Monochrome Low-Power Display Library
21st June 2022
This is a small graphics library for an interesting low-power monochrome 250x122 display based on the ST7302 display driver and available from suppliers such as AliExpress:
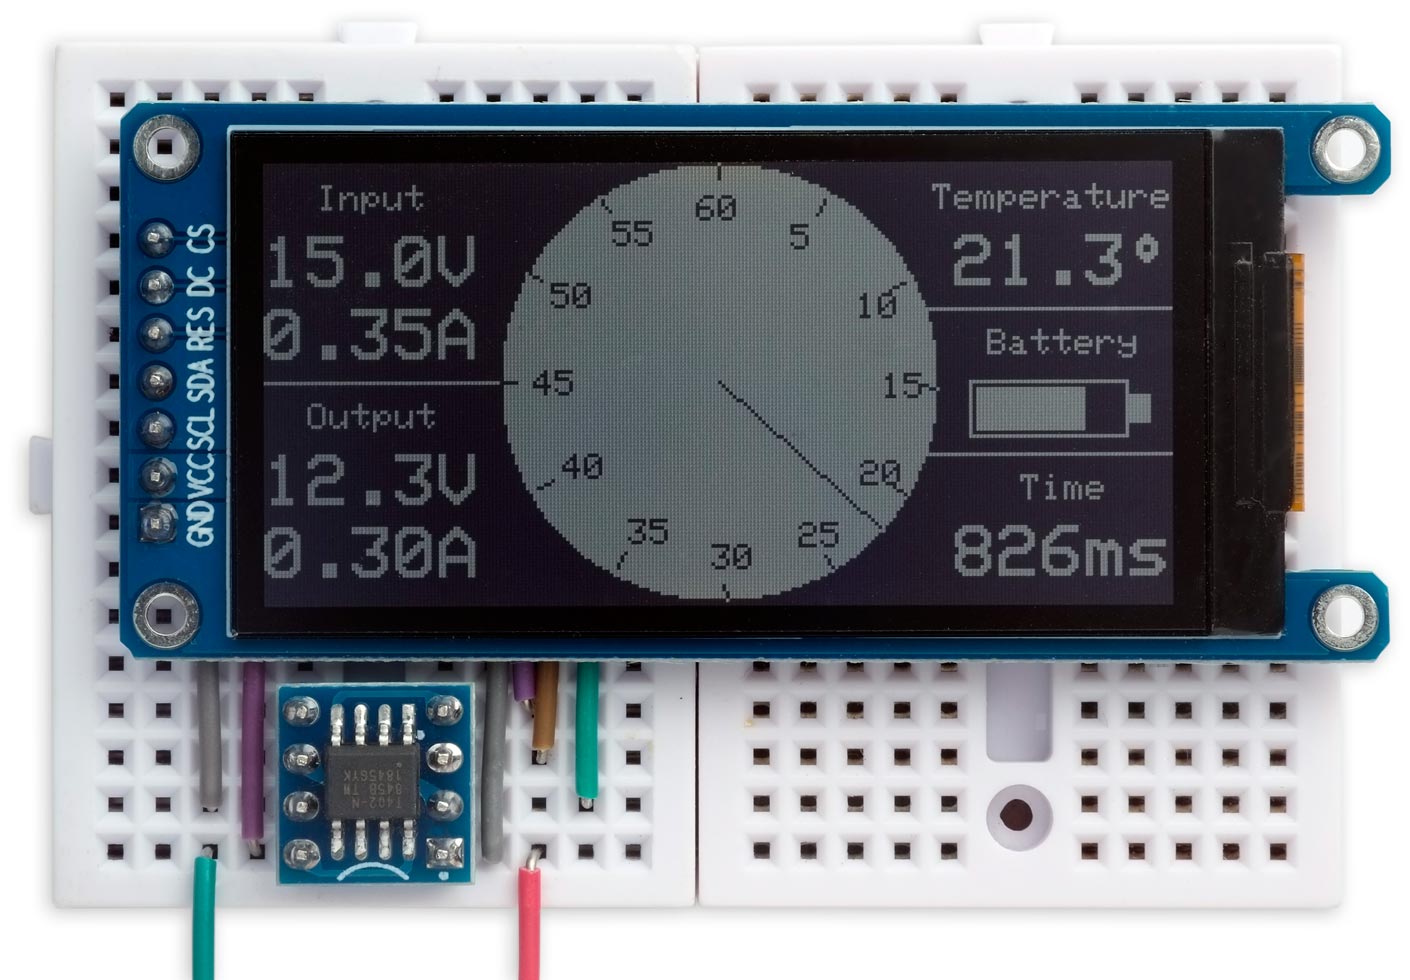
Monochrome Low-Power ST7302 Display Library running on an ATtiny402.
The display doesn't need a backlight so it's very low power, typically about 30µA at 3.3V, which is ideal for battery-powered projects. For comparison a colour TFT display typically takes 20mA.
The graphics library allows you to plot points, draw lines, draw outline and filled rectangles, draw outline and filled circles, and plot characters and text at normal size, or double size with smoothing. The whole library with the demo program fits in 4Kbytes and so will run on an ATtiny402/412 or ATtiny45
For an application of this display and the routines described here see Lisp Badge LE.
Introduction
In my search for interesting displays I discovered this monochrome 250x122 TFT display, based on the ST7302 display driver, and available on AliExpress from Maithoga [1] or Hong Kong Fen Tai [2]. Like e-ink displays it's readable in daylight without a backlight, but has faster update so you can create an animated clock as in the demo. It's similar to the Sharp Memory display I used in my project ATtiny85 Analogue Clock.
I've made a variant of my Tiny TFT graphics routines to work with this display. Like my Tiny TFT Graphics Library 2 it supports both the classic ATtiny processors, such as the ATtiny85, and the new 0-series, 1-series, and 2-series ATtiny processors, such as the ATtiny402.
The display uses an SPI interface and requires four pins to drive the display. This leaves one pin free on an 8-pin chip such as the ATtiny85 or ATtiny402. If you need more pins choose a larger chip, such as the ATtiny84 or ATtiny404.
I've included a demo program that draws a control panel with a stopwatch to demonstrate the graphics commands.
Graphics commands
Here is a summary of the graphics commands provided by this library:
Clearing the display
ClearDisplay() clears the display to black:
void ClearDisplay ()
Inverting the display
If you prefer the display with black plotting on a white background you can select:
InvertDisplay (false)
Putting the display to sleep
To put the display to sleep:
SleepDisplay (true)
The sleep mode blanks the image, but retains the contents of display memory, and reduces the current consumption to about 4µA.
Plotting points and drawing lines
The library includes basic graphics routines for plotting points and drawing lines. These work on a conventional coordinate system with the origin at lower left:
The current drawing position is stored in the global variables xpos and ypos. You can change this with MoveTo():
void MoveTo (int x, int y)
PlotPoint() plots a single point in the current foreground colour:
void PlotPoint (int x, int y)
DrawTo() draws a line in the foreground colour from the current drawing position to x,y, and updates the drawing position to this:
void DrawTo (int x, int y)
Drawing rectangles
DrawRect() draws an outline rectangle and FillRect() draws a filled rectangle in the foreground colour with width w and height h, and the bottom left corner at the current drawing position:
void DrawRect (int w, int h)
void FillRect (int w, int h)
The drawing position doesn't change.
Drawing circles
DrawCircle() draws an outline circle and FillCircle() draws a filled circle in the foreground colour with radius radius, and the centre at the current drawing position:
void DrawCircle (int radius)
void FillCircle (int radius)
The drawing position doesn't change.
Plotting characters and text
The library includes a character set based on a 5x7 dot matrix.
PlotChar() plots a specified character at the current plot position, and in the current foreground colour:
void PlotChar (char c)
You can plot double-sized characters by setting the global variable scale to 2; the default value is 1. Double-sized characters can be smoothed by setting smooth to true.
After plotting a character PlotChar() moves the drawing position to the start of the next character to make it easy to plot several characters in a row without needing to call MoveTo().
PlotText() plots text from a string in program memory:
void PlotText (PGM_P p)
See the demo program for examples.
PlotInt() plots an integer:
void PlotInt (int i)
How it works
Initialization
Getting the correct set of initialization parameters for the display was quite a struggle, and there are some commands that take 10 parameters! Luckily I didn't have to start from scratch; I was very grateful that zhcong on GitHub has already written an Arduino display driver for the display [3].
Display memory
The display driver is the ST7302 [4], and it shares some similarities with the ST7735 used for colour TFT displays. Here's the display layout:
The display driver treats the display as if it's in portrait orientation, so the columns correspond to the y direction, and the rows to the x direction. I'll keep with this terminology for consistency with the datasheet.
The display is divided into 11 columns, each of which is 12 pixels high, and 125 rows, each of which is 2 pixels wide. For some reason the columns are numbered starting at 25, so the 250x122 monochrome display uses columns 25 to 35 and rows 0 to 124. note that because 122 isn't an exact multiple of 12, only part of the last column actually appears on the display.
Unlike on the colour TFT displays each pixel isn't individually addressable; in fact, the minimum update is to write three bytes to the display, which defines the state of a block of 2x12 pixels corresponding to one column and one row. Fortunately the display supports reading back the display memory, so it's not necessary to maintain a copy of the display in RAM to do things like line drawing; instead, to set a single pixel we can read the 2x12 block, change one pixel, and write it back.
Core routines to read and write a block
To make writing the other plotting routines easier I first wrote a routine ReadBlock() to read a block from the display memory, and PlotBlock() to write a block back to display memory. These both take the column, from 0 to 10, and the row, from 0 to 124:
Here's PlotBlock():
void PlotBlock (uint32_t block, uint8_t row, uint8_t column) {
  PORT_TOGGLE(1<<cs);
  Command2(CASET, 25+column, 25+column);
  Command2(RASET, row, row);
  Command(RAMWR); Data(block>>16); Data(block>>8); Data(block);
  PORT_TOGGLE(1<<cs);
}
and here's ReadBlock():
uint32_t ReadBlock (uint8_t row, uint8_t column) {
  uint32_t pix = 0;
  PORT_TOGGLE(1<<cs);
  Command2(CASET, 25+column, 25+column);
  Command2(RASET, row, row);
  Command(RAMRD);
  PORTA.DIRCLR = 1<<mosi;                  // mosi input
  for (uint8_t i=0; i<25; i++) {
    PORT_TOGGLE(1<<sck);
    pix = pix<<1 | (PORTA.IN>>mosi & 1);
    PORT_TOGGLE(1<<sck);
  }
  PORTA.DIRSET = 1<<mosi;                  // mosi output
  PORT_TOGGLE(1<<cs);
  return pix;
}
When reading from display memory you have to do a dummy read, which is why the main loop is executed 25 times rather than 24 times.
Plotting points
My first version of the PlotPoint() routine read a 24-pixel block, set a point, and wrote back the block:
void PlotPoint (int x, int y) {
  uint8_t v = 121 - y;
  uint8_t row = x/2, column = v/12;
  uint32_t bit = (~x)&1 | (11 - v%12)<<1;
  uint32_t pixels = ReadBlock(row, column);
  pixels = pixels | (uint32_t)1<<bit;
  PlotBlock(pixels, row, column);
}
This is very inefficient if you're plotting multiple points in a single block. For each point the routine reads a block, changes one pixel, and writes it back. An extreme example is drawing a vertical line through one block: this involves 12 reads and 12 writes. Instead all we need to do is read once at the beginning and write once at the end, saving 11 reads and 11 writes.
The solution is to use a lazy reading and writing technique. I keep track of the last block accessed, and only write the old block, and read the new block, when the coordinates of the block have changed:
void PlotPoint (int x, int y) {
  static uint8_t row0 = 255/2, column0 = 0;
  static uint32_t pixels;
  uint8_t v = 121 - y;
  uint8_t row = x/2, column = v/12;
  uint32_t bit = (~x)&1 | (11 - v%12)<<1;
  if (row != row0 || column != column0) {
    PlotBlock(pixels, row0, column0);
    pixels = ReadBlock(row, column);
    row0 = row; column0 = column;
  }
  pixels = exor ? pixels ^ (uint32_t)1<<bit : pixels | (uint32_t)1<<bit;
}
The only additional change to the program was to add a dummy PlotPoint() statement in DrawTo() to ensure that the last block is written back at the end of a line:
PlotPoint(255, 0); // Flush
Because points are plotted by reading the previous contents of the display, it's also easy to add an exclusive-OR plotting mode that inverts the pixel rather than setting it to black. To select this mode set the global variable exor to true.
I also changed both FillCircle() and FillRect() to draw vertical lines rather than horizontal lines, as vertical lines benefit more from the lazy plotting.
The following table shows the improvement in performance of the lazy approach, with a 20MHz ATtiny402:
| Original plotting | Lazy plotting | |
| FillCircle(60) | 2471ms | 589ms |
| FillRect(60,60) | 458ms | 111ms |
| Demo() | 3773ms | 826ms |
Drawing circles
The routines DrawCircle(), which draws an outline circle, and FillCircle(), which draws a filled circle, both call DoCircle() which takes two functions as parameters; these are called at the start and end of each vertical band:
typedef void *(circle_type)(int, int);

void DoCircle (uint8_t radius, circle_type fun1, circle_type fun2) {
  uint8_t x1 = xpos, y1 = ypos; int dx = 1, dy = 1;
  uint8_t x = radius - 1, y = 0;
  int err = dx - (radius<<1);
  while (x >= y) {
    fun1(x1+x, y1-y); fun2(x1+x, y1+y); //4
    fun1(x1+y, y1-x); fun2(x1+y, y1+x); //3
    fun1(x1-y, y1-x); fun2(x1-y, y1+x); //2
    fun1(x1-x, y1-y); fun2(x1-x, y1+y); //1
    if (err > 0) {
      x = x - 1; dx = dx + 2;
      err = err - (radius<<1) + dx;
    } else {
      y = y + 1; err = err + dy;
      dy = dy + 2;
    }
  }
  xpos = x1; ypos = y1;
}
The difference is that for DrawCircle() the functions are both PlotPoint(), but for FillCircle() they are MoveTo() and DrawTo():
void DrawCircle (uint8_t radius) {
  DoCircle(radius, PlotPoint, PlotPoint);
}

void FillCircle (uint8_t radius) {
  DoCircle(radius, MoveTo, DrawTo);
}
Plotting characters and text
I've provided routines to allow you to plot single characters, or a line of text, using a 6x8 pixel matrix. The bottom left-hand corner of each character is determined by the current plotting position, which you can set with MoveTo().
Character plotting works by calling PlotPoint() for each pixel in the character, so it takes advantage of lazy plotting. Double-height characters optionally use the smoothing technique I described in Smooth Big Text.
PlotText() plots text from a constant string in program memory; for example:
PlotText(PSTR("Temperature"));
PlotChars() plots text from a char array; for example, to display a floating-point value:
float Sensorval = 5.23;
char buff[10];
dtostrf(sensorVal, 4, 2, buff);
PlotChars(buff);
Demo program
The demo program draws the display used for the photograph at the start of the article. It demonstrates most of the graphics routines including normal-sized text, and double-sized text with smoothing. The stopwatch uses the Minsky circle algorithm to move the hand in 60 increments around the circle using just integer arithmetic. It takes advantage of exclusive-OR plotting to draw and undraw the hand when it moves without corrupting the clock face. The bottom right corner shows the time taken to draw the display.
Connecting the display
The display pins SCL, SDA, CS, and DC need to be connected to the microcontroller via four I/O lines. You can use any pins for these, but they should all be in the same port. You need to specify the port pin numbers of the pins you are using at the start of the Monochrome Display Library listing. The reset line has to be kept high for the display to work.
The display is 3.3V only, so if you want to connect it to a 5V microcontroller you'll need a 3.3V regulator, unidirectional logic-level conversion on the SCL, CS, and DC lines, and bidirectional logic-level conversion on the SDA line.
ATtiny85/45
By default, the Monochrome Display Library specifies these pins in PORT B for an ATtiny85/45:
int const dc = 0;
int const mosi = 1;
int const sck = 2;
int const cs = 3;
Here's the corresponding circuit diagram:
Circuit of the monochrome graphics display interface using an ATtiny85.
The 33kΩ pullup resistor from the display's CS pin is optional; it holds the chip select high to prevent the display from flickering while programming the ATtiny85.
ATtiny402/412
By default, the Monochrome Display Library specifies these pins in PORT A for an ATtiny402/412:
int const dc = 7;
int const mosi = 1;
int const sck = 3;
int const cs = 6;
Here's the corresponding circuit diagram:
Circuit of the monochrome graphics display interface using an ATtiny402.
Compiling the graphics library
ATtiny85/45
Compile the program using Spence Konde's ATTiny Core [5]. Choose the ATtiny25/45/85 (No bootloader) option under the ATTinyCore heading on the Board menu. Then check that the subsequent options are set as follows (ignore any other options):
Chip: "ATtiny85"
Clock Source: "8 MHz (internal)"
By default the ATtiny85 runs at 1MHz. Choose Burn Bootloader to set the fuses for 8MHz operation, or your graphics will run rather slowly, then upload the program using a 3.3V ISP (in-system programming) programmer.
ATtiny402/412
Compile the program using Spence Konde's megaTinyCore [6]. Choose the ATtiny412/402/212/202 option under the megaTinyCore heading on the Board menu. Check that the subsequent options are set as follows (ignore any other options):
Chip: "ATtiny402" (or as appropriate)
Clock: "20 MHz internal"
Then upload the program using a 3.3V UPDI programmer. The recommended option is to use a USB to Serial board, such as the SparkFun FTDI Basic board [7], connected with a 4.7kΩ resistor as follows:
Set the Programmer option to "SerialUPDI with 4.7k resistor or diode (230400 baud)".
Resources
Here's the display library with the demo program: Monochrome Low-Power Display Library Program.
Updates
14th January 2024: By popular request added a function PlotText() to plot text from a char array.
- ^ 2.13 inch TFT Display 122x250 from Maithoga on AliExpress.
- ^ 2.13 inch TFT Display 122x250 from Hong Kong Fen Tai on AliExpress.
- ^ ST7302 for Arduino on GitHub.
- ^ ST7302 Datasheet download from GitHub.
- ^ ATTinyCore on GitHub.
- ^ megaTinyCore on GitHub.
- ^ SparkFun FTDI Basic Breakout - 3.3V on Sparkfun.
blog comments powered by Disqus