Tiny Function Plotter
14th October 2018
This project describes a simple routine for plotting a function on a 128x64 I2C OLED graphics display. Unlike most Arduino graphics libraries this routine doesn't require a RAM buffer, and so will work on any processor down to an ATtiny85:
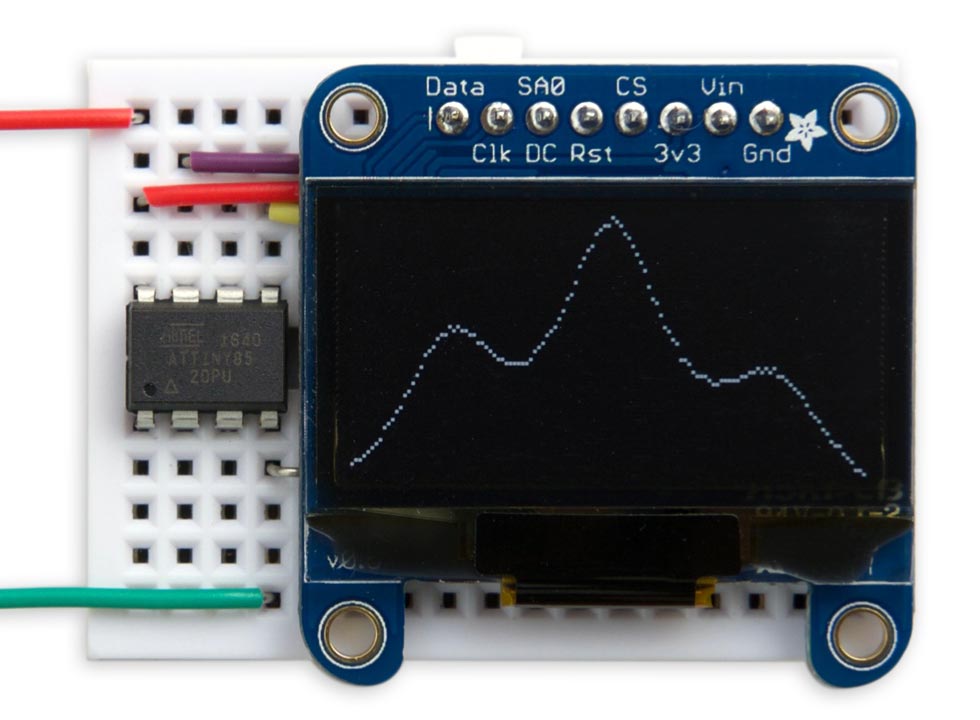
Tiny Function Plotter running on an ATtiny85 with an Adafruit 128x64 monochrome OLED display.
The routine will work on monochrome 128x64 I2C OLED displays based on either the SSD1306 driver, such as the display available from Adafruit, or the SH1106 driver, used in displays available from Chinese suppliers.
Introduction
My earlier Tiny Graphics Library supported text and graphics plotting on displays using the SH1106 driver chip. Unlike those routines, these simpler routines will also work on the more commonly available displays based on an SSD1306 driver, such as Adafruit's 128x64 monochrome OLED display.
A restriction with these routines is that they can only plot one value or pixel in each column; in other words, a function. For many applications, such as plotting the value from a sensor against time, this is exactly what you want, so this minimal routine is ideal.
This routine has a second mode which plots histograms rather than points; it still plots only one value per column, but the value is represented by a vertical bar rather than a point. This is useful for showing something like network activity:
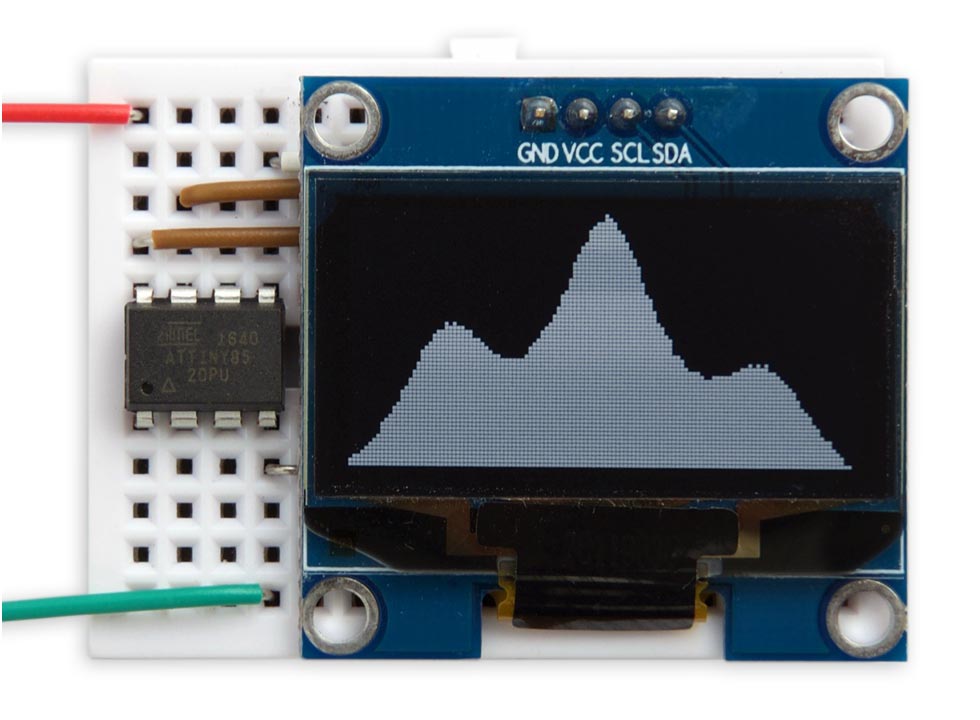
Tiny Function Plotter running on an SH1106-based display showing histogram plot mode.
Display variants
This routine supports a wide range of 128x64 monochrome OLED displays available from Adafruit and AliExpress. For details see below.
Sizes
The displays come in two sizes: 0.96" and 1.3" diagonal. Both fit nicely on small prototyping boards, but to my mind the 1.3" one is ideal.
Colours
The displays are monochrome, but come in three alternative colours: white, blue, or yellow. There's also a bi-colour display with the top 8 rows yellow and the lower 56 rows blue, which is nice if you want to display status indicators on the top rows. Note that there's a gap between the two sections.
SSD1306 vs. SH1106
An important difference between the different makes of 128x64 monochrome OLED display is the driver chip they use to interface between the processor (via SPI or I2C) and the display.
The Adafruit display uses the SSD1306 driver [1]. This provides three addressing modes: page (the default), horizontal, and vertical. It doesn't support reading back from the display memory.
Most Chinese displays use the SH1106 driver (despite some of them claiming to use the SSD1306). The SH1106 is generally compatible with the SSD1306 but supports a maximum display size of 132x64 [2]. When used with 128x64 displays the display is usually centred in the display area which will cause a horizontal offset of 2 pixels if you use a graphics library that doesn't allow for this. This explains many of the complaints on the customer feedback on Banggood and other sites.
The SH1106 only supports page addressing mode, and ignores the commands for horizontal or vertical addressing. However, it has the advantage that it supports reading back the display memory in I2C mode; this makes it possible to design graphics plotting routines that don't need a RAM memory buffer as in my Tiny Graphics Library.
The circuits
Adafruit SSD1306 display
The Adafruit display is available in two versions; a 1.3" size [3], and a 0.96" size [4]. Here's the circuit:
Driving the Adafruit 128x64 monochrome OLED display from an ATtiny85.
To use the original versions of these displays with I2C you needed to make two links with solder blobs on the back of the board. The latest versions default to I2C and include two STEMMA QT connectors. The default I2C address on both versions is #x3D or 61.
The original versions of the Adafruit displays were a bit finicky about being reset correctly, and I found I needed to add the 1µF capacitor and 33kΩ resistor to get reliable results. This has been solved in the latest versions, so you can omit these components.
Chinese SH1106 display
A typical SH1106-based OLED display is the 1.3" OLED display from Diymore [5]. Here's the circuit:
Driving a Chinese 128x64 monochrome OLED display from an ATtiny85.
On these displays the default I2C address is #x3C or 60.
The programs
Each display needs to be initialised by a call to InitDisplay(). Many of the parameters are initialised to an approriate value on reset, so there's no need to set these. The main settings are to set the correct display orientation and turn the display on. For the SSD1306 we also set vertical addressing mode and change some settings that increase the display brightness.
The main PlotPoint() routine plots a column of eight bytes. In point mode we simply have to set the appropriate bit in the eight bytes corresponding to the y value we want to plot. In histogram mode we set all the bits below this bit.
For the SSD1306 version of PlotPoint() we can take advantage of vertical addressing mode, which automatically plots bytes in successive pages within a single column. The 0x21 command sets the column range, and the 0x22 command sets the page range:
void PlotPoint (int x, int y, int mode) {
  Wire.beginTransmission(address);
  Wire.write(commands);
  Wire.write(0x21); Wire.write(x); Wire.write(x);  // Column range
  Wire.write(0x22); Wire.write(0); Wire.write(7);  // Page range
  Wire.endTransmission();
  Wire.beginTransmission(address);
  Wire.write(data);
  for (int i=0; i<8; i++) {
    if (y > 7) Wire.write(- mode);
    else if (y < 0) Wire.write(0);
    else Wire.write((1<<y) - mode);
    y = y - 8;
  }
  Wire.endTransmission();
}
Version of the Tiny Function Plotter routine for SSD1306-based displays.
The x value can be between 0 and 127, and the y value can be from 0 and 63, with (0, 0) corresponding to the bottom left corner. Setting the mode parameter to 0 plots points, and 1 plots vertical bars.
The SH1106 only supports page addressing mode, so for each byte of data we have to specify the column and page. This version of PlotPoint() also includes an offset of 2, as explained above:
void PlotPoint (int x, int y, int mode) {
  x = x + 2;
  for (int i=0; i<8; i++) {
    Wire.beginTransmission(address);
    Wire.write(onecommand);
    Wire.write(0x00 + (x & 0x0F));                 // Column low nibble
    Wire.write(onecommand);
    Wire.write(0x10 + (x>>4 & 0x0F));              // Column high nibble
    Wire.write(onecommand);
    Wire.write(0xB0 | i);                          // Page
    Wire.write(onedata);
    if (y > 7) Wire.write(- mode);
    else if (y < 0) Wire.write(0);
    else Wire.write((1<<y) - mode);
    y = y - 8;
    Wire.endTransmission();
  }
}
Version of the Tiny Function Plotter routine for SH1106-based displays.
For both versions to clear the display we can simply write a zero-height histogram bar for every x value:
void ClearDisplay () {
  for (int x=0; x<128; x++) PlotPoint(x, 0, 1);
}
Finally, here's the demo program I used to draw an interesting function for the photographs. It superimposes three approximations to Gaussian curves:
int e (int x, int f, int d, int m) {
  return (f * d * d) / ((d * d) + ((x - m) * (x - m)));
}

void loop () {
  for (int x=0; x<128; x++) {
    int y = e(x, 40, 16, 24) + e(x, 68, 12, 64) + e(x, 30, 16, 104) - 14;
    PlotPoint(x, y, 1);
  }
  for (;;);
}
Compiling the programs
I compiled the programs using Spence Konde's ATTiny Core [6]. Choose the ATtiny25/45/85 option under the ATtinyCore heading on the Board menu. Then choose Timer 1 Clock: CPU, B.O.D. Disabled, ATtiny85, 8 MHz (internal) from the subsequent menus. Choose Burn Bootloader to set the fuses appropriately. Then upload the program using ISP (in-system programming); I used Sparkfun's Tiny AVR Programmer Board; see ATtiny-Based Beginner's Kit.
Here's the SSD1306 version of the Tiny Function Plotter program: Tiny Function Plotter Program (SSD1306).
And here's the SH1106 version of the Tiny Function Plotter program: Tiny Function Plotter Program (SH1106).
Further suggestions
These routines are designed for I2C displays, but should work with SPI displays with minor changes.
The I2C displays described here can be set to two alternative I2C addresses, 60 or 61. With the Adafruit display it's determined by the state of the DC pin, and for the SH1106-based displays you change a link on the back of the circuit board. This means that you could use the same routine to drive two separate displays.
This plot routine will work equally well with 128x32 monochrome OLED displays, and other formats, with a few small changes.
If you want to add axes, text, and do arbitrary graphics, and you've got a display based on an SH1106 driver chip, check my other article Tiny Graphics Library. Otherwise use Adafruit's SSD1306 Arduino graphics library [7].
Update
7th March 2022: Updated the description to refer to the latest versions of the displays from Adafruit.
- ^ SSD1306 datasheet on Adafruit.
- ^ SH1106 datasheet on Velleman.
- ^ Monochrome 1.3" 128x64 OLED graphic display on Adafruit.
- ^ Monochrome 0.96" 128x64 OLED graphic display on Adafruit.
- ^ 1.3" OLED LCD Display Module I2C 128x64 on AliExpress.
- ^ ATTinyCore on GitHub.
- ^ Adafruit_SSD1306 on GitHub.
blog comments powered by Disqus