Three-Channel Chart Plotter
14th June 2022
This project is a three-channel chart plotter that allows you to display the signals from three analogue inputs on a scrolling OLED display:
Three-Channel Chart Plotter based on an ATtiny402/412
and a 128x64 monochrome OLED display.
It's based on an ATtiny402 or ATtiny412, and a monochrome 128x64 OLED display. It supports I2C displays based on either an SSD1306 or SH1106 driver chip.
Introduction
This project began when I wanted to display the outputs of three analogue inputs on a monochrome OLED display, to simulate the mechanical chart recorders with pens that draw a trace, typically an EEG or ECG, on a scrolling strip of paper. I remembered that OLED displays support a screen scroll function, and decided to see if I could use that.
My design aims for this project were to use the 8-pin ATtiny85 microcontroller to make the project as compact as possible, and use the Arduino Wire I2C interface to avoid the need to install other libraries. As you'll see, it didn't quite work out as I had planned.
Microcontroller
However, I soon realised that my old favourite processor, the ATtiny85, doesn't allow you to have three analogue inputs at the same time as I2C. Fortunately the new 0-series and 1-series 8-pin ATtiny chips don't have this problem so I switched to the ATtiny402/412.
I2C library
Now the problem with the ATtiny402/412 is that they only have 256 bytes of RAM. The megaTinyCore version of Arduino Wire uses 88 bytes, and my program requires 192 bytes as explained below, which totals 280 bytes, exceeding the 256 available.
Although I didn't intend this project to be an advertisement for my TinyI2C library, I had to switch to using that to make the project possible.
Display
There are several monochrome OLED displays with a resolution of 128x64. This project uses an I2C interface like the Adafruit 0.96" display [1] or Adafruit 1.3" display [2], which are both based on the SSD1306 driver chip [3].
This project also supports similar I2C displays from suppliers like Banggood and AliExpress, such as the 1.3" OLED display from Diymore [4], which are based on the SH1106 driver chip [5].
Both the SSD1306 and SH1106 support vertical scrolling, allowing you to specify the vertical position of the display to one-pixel precision. This chart plotter takes advantage of this to scroll the display smoothly without needing to redraw the entire display contents.
Memory requirements
The display is divided into eight 8-pixel high bands, referred to as pages, and a byte corresponds to a vertical column of 8 pixels, with the bits ordered as shown in the following diagram:
Because each byte corresponds to a column of 8 pixels, to change one pixel we need to know the previous contents of the whole byte, and unfortunately the SSD1306 doesn't support reading back the display memory. At first sight it looks like we'll need to store a copy of the entire display memory, which is 128x64/8 or 1024 bytes, way beyond the 256 bytes of RAM in the ATtiny402/412.
However, for each chart there's only one point at each y position, so we only need to store the x coordinates of these three points, which is 64x3 or 192 bytes.
The circuit
Here's the circuit using the Adafruit display, which is available in two versions; a 1.3" size [6], and a 0.96" size [7]:
Three-Channel Chart Plotter based on an ATtiny402/412
and an Adafruit 128x64 monochrome OLED display.
The current versions of these displays default to I2C and include two STEMMA QT connectors. The default I2C address on both versions is #x3D or 61.
If you have one of the original versions of these displays, without STEMMA QT connectors, you need to make two links with solder blobs on the back of the board to select I2C. They were also a bit finicky about being reset correctly, and I found I needed to add a 1µF capacitor and 33kΩ resistor to get reliable results (this has been solved in the current versions):
Reset circuit for the original Adafruit 128x64 monochrome OLED display.
SH1106 display
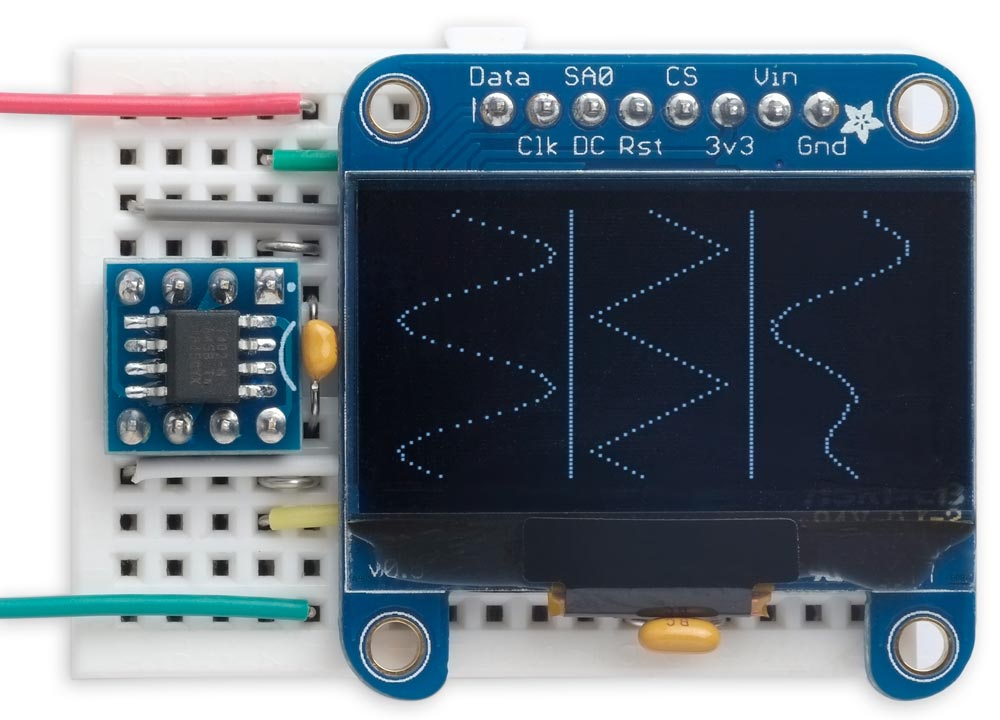
The Three-Channel Chart recorder will also work with an I2C SH1106-based 128x64 OLED display. A typical one is the 1.3" OLED display from AliExpress [8]:
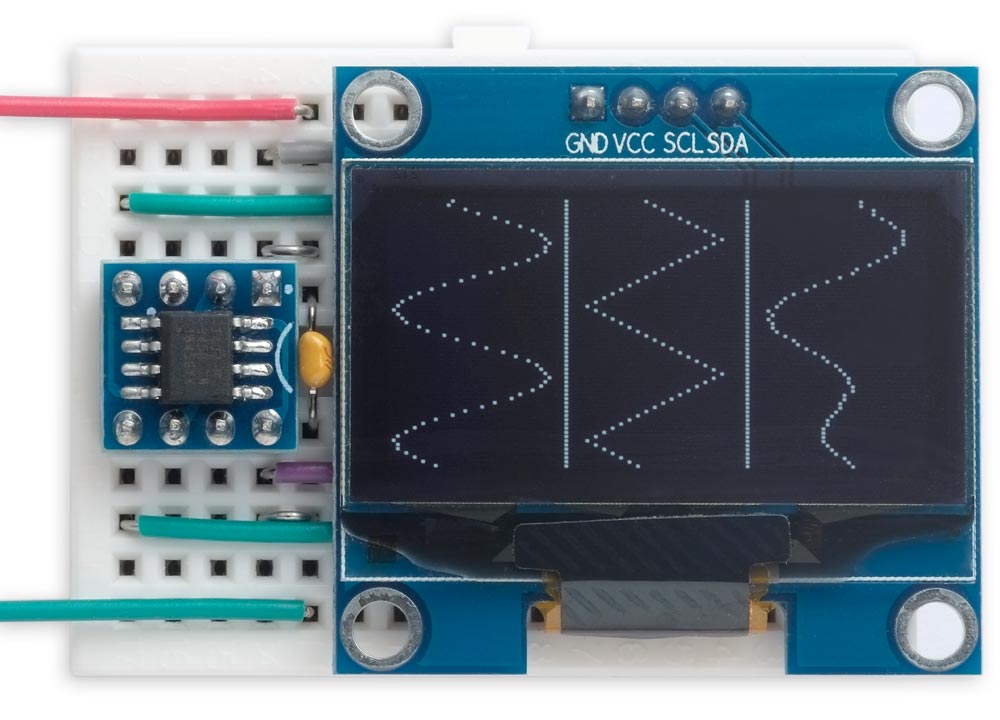
Three-Channel Chart Plotter running on an SH1106 monochrome OLED display.
Here's the circuit:
Three-Channel Chart Plotter based on an ATtiny402/412
and an SH1106 monochrome OLED display.
On these displays the default I2C address is #x3C or 60.
To use an SH1106 display comment out the line in the program:
#define SSD1306
The program
The SSD1306 display driver supports three addressing modes, which determine how successive bytes are written to the display memory. The SH1106 has a simpler set of commands, and only supports the Page Addressing mode, but fortunately all the commands it does support are compatible with the SSD1306. I therefore wrote the program using just Page Addressing so it will work on either display without modification.
Plotting a byte
The main plotting routine used by the Chart Plotter is PlotByte(), which plots a vertical column of eight pixels in a specified page and column:
void PlotByte (uint8_t byte, uint8_t page, uint8_t column) {
  TinyI2C.start(address, 0);
  TinyI2C.write(commands);
  TinyI2C.write(0x00 | ((column+offset) & 0x0F));  // Column start low
  TinyI2C.write(0x10 | (column+offset)>>4);        // Column start high
  TinyI2C.write(0xB0 | (page & 0x07));             // Page start
  TinyI2C.restart(address, 0);
  TinyI2C.write(data);
  TinyI2C.write(byte);
  TinyI2C.stop();
}
The SH1106 supports a maximum display size of 132x64, so when used with 128x64 displays the display is usually centred in the display area. PlotByte() therefore needs to take account of this by adding an x offset of 2 pixels.
A similar routine ClearDisplay() is used to clear the display, but here we don't need to specify the start column, since the column just wraps around.
Finally, SetStartLine() writes the command to set the start line of the display, which is used to scroll the display:
void SetStartLine (uint8_t line) {
  TinyI2C.start(address, 0);
  TinyI2C.write(onecommand);
  TinyI2C.write(0x40 | line);
  TinyI2C.stop();
}
Chart program
Each chart is 42 pixels wide, and there are two one-pixel dividers between the charts, so 42 x 3 + 2 makes 128, the width of the display.
The Chart Plotter starts by calling DrawDividers(), to draw the two vertical line dividers:
void DrawDividers () {
  for (int p = 0; p<8; p++) {
    PlotByte (0xFF, p, 42);
    PlotByte (0xFF, p, 85);
  }
}
Then the main work is then done by the routine Plot(). This takes three parameters:
- The x coordinate on the chart to be plotted, fom 0 to 41.
- The row or y coordinate, from 0 to 63.
- The chart number, from 0 to 3.
The routine needs to plot the new point, and unplot the previous point in the same row and chart. This involves updating two bytes in the display memory; the one containing the new point, and the one containing the old point. In each case we need to leave the pixels corresponding to the other rows unchanged. The solution is to maintain an array Position[] storing the x position of each point on each of the three charts for every row of the display. For convenience I made it a three-dimensional array:
uint8_t Position[chart][page][bit];
where chart is 0 to 3, page is 0 to 7, and bit is 0 to 7, making a total of 192 bytes.
The value of each element of the Position[] array can be 0 to indicate that there is no point, or 1 to 42 to specify one plus the x position of the point in the chart.
Here's the routine Plot():
void Plot (uint8_t newvalue, uint8_t row, uint8_t chart) {
  newvalue = newvalue + 1;
  uint8_t page = row>>3, bit = row & 0x07;
  // Only change column corresponding to old and new values
  uint8_t oldvalue = Position[chart][page][bit];
  Position[chart][page][bit] = newvalue;
  uint8_t oldbyte = 0, newbyte = 0;
  for (int b=0; b<8; b++) {
    uint8_t pos = Position[chart][page][b];
    if (pos == oldvalue) oldbyte = oldbyte | 1<<b;
    if (pos == newvalue) newbyte = newbyte | 1<<b;
  }
  if (oldvalue != 0) PlotByte(oldbyte, page, chart * 43 + oldvalue - 1);
  if (newvalue != 0) PlotByte(newbyte, page, chart * 43 + newvalue - 1);
}
Reading the analogue inputs
The Chart Plotter plots the value on each of the three analogue inputs, corresponding to Arduino pins 0, 1, and 4. The routine Reading() reads the input for the appropriate chart, and returns the value scaled to the range 0 to 41:
int Reading (uint8_t chart) {
  uint8_t pin = chart;
  if (chart == 2) pin = 4;
  return (analogRead(pin)+12)/25;
}
The main program
The main program, in loop(), then simply plots the three readings and scrolls the display:
void loop () {
  static uint8_t Row;
  Row = (Row + 1) % 64;
  SetStartLine(Row);
  for (int c=0; c<3; c++) Plot(Reading(c), (Row + 62) % 64, c);
  delay(Delay);
}
The constant Delay determines how fast the readings are taken and the display scrolls. I had to experiment a bit to stop the bottom line of the display flickering, but it's perfect now.
To take the photographs used in this article I used a dummy version of Reading() that plots three waveforms on the display. I've included this in the program listing. Comment this out and uncomment the other version to plot the analogue inputs.
Compiling the program
Compile the program using Spence Konde's megaTinyCore [9]. Choose the ATtiny412/402/212/202 option under the megaTinyCore heading on the Board menu. Check that the subsequent options are set as follows (ignore any other options):
Chip: "ATtiny402" (or as appropriate)
Clock: "20 MHz internal"
Then upload the program using a UPDI programmer. The recommended option is to use a USB to Serial board, such as the SparkFun FTDI Basic board [10], connected with a 4.7kΩ resistor as follows:
Set the Programmer option to "SerialUPDI with 4.7k resistor or diode (230400 baud)".
Resources
Here's the Three-Channel Chart Plotter program: Three-Channel Chart Plotter Program.
Get the TinyI2C library from GitHub here: TinyI2C Library.
- ^ Monochrome 0.96" 128x64 OLED Graphic Display on Adafruit.
- ^ Monochrome 1.3" 128x64 OLED Graphic Display on Adafruit.
- ^ SSD1306 datasheet on Adafruit.
- ^ 1.3" OLED LCD Display Module I2C 128x64 on AliExpress.
- ^ SH1106 datasheet on Velleman.
- ^ Monochrome 1.3" 128x64 OLED graphic display on Adafruit.
- ^ Monochrome 0.96" 128x64 OLED graphic display on Adafruit.
- ^ OLED Display Module 1.3" 128x64 White on AliExpress.
- ^ megaTinyCore on GitHub.
- ^ SparkFun FTDI Basic Breakout - 5V on Sparkfun.
blog comments powered by Disqus