Tiny Graphics Library
28th March 2018
This small graphics library provides point, line, and character plotting commands for use with an I2C 128x64 OLED display on an ATtiny85:
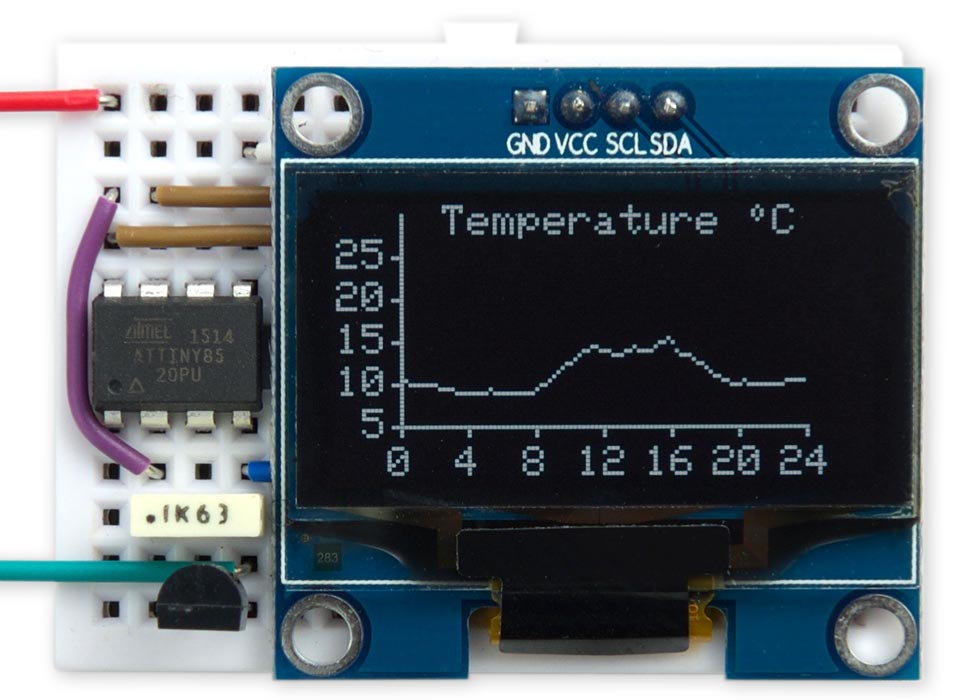
Using the Tiny Graphics Library to plot the outside temperature over 24 hours
on a 128x64 OLED display using an ATtiny85.
It supports processors with limited RAM by avoiding the need for a display buffer, and works with I2C OLED displays based on the SH1106 driver chip. These are available for a few dollars from a number of Chinese suppliers.
To demonstrate the graphics library I've written a simple application to measure the temperature every 15 minutes over a 24-hour period and display it as a live chart.
Note that this project will not work with I2C OLED displays based on the SSD1306 driver chip. For an example of plotting on these displays see my article Tiny Function Plotter.
Introduction
The monochrome OLED graphics displays are accessed a byte at a time, and each byte represents 8 pixels; to plot a point you need to change just one pixel leaving the others unaffected, so you need to know what the previous contents of the byte were.
The usual way to implement graphics commands on this type of display is to use a RAM buffer, and do all the drawing into the buffer. You then copy the entire buffer to the display when you want to update the display. This is the approach taken by Adafruit in their SSD1306 library [1]. However, a 128x64 monochrome display requires a 1024-byte buffer, which rules out the ATtiny85 because it only has 512 bytes of RAM. The largest display the ATtiny85 can support this way is 64x48, as in my ATtiny85 Graphics Display.
The OLED displays available from Chinese suppliers tend to be based on the SH1106 driver chip rather than the SSD1306 used in the displays sold by Adafruit. While browsing the SH1106 datasheet [2] I noticed that the I2C interface not only supports writing data to the display, but also reading data back from the display, making it possible to have a full 128x64 graphics display without needing any RAM buffer. This allows you to provide a full graphics display to projects based on the ATtiny85, and the other ATtiny processors.
I've tested this library with the Geekcreit 1.3" I2C OLED display, available from Banggood [3]:
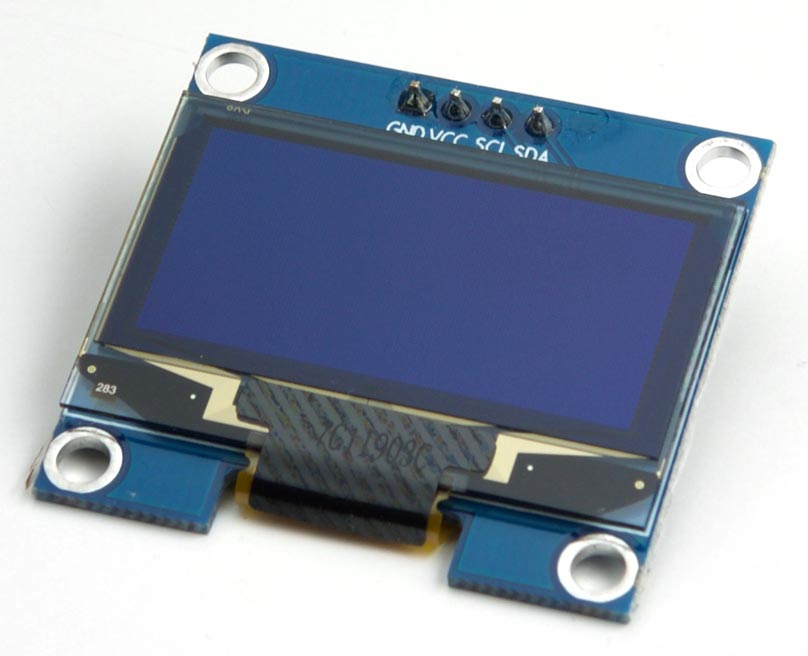
Displays are also available from AliExpress and eBay, in the sizes 0.96" and 1.3" (screen diagonal), and in white, blue, or yellow/blue. Note that they are sometimes mislabelled "SSH1106".
Note that this library will only work with I2C displays, which have four pins. It will not work with SPI displays, or with displays based on the SSD1306 or SSD1309 driver chips, as none of these support reading back the display memory. If you want to plot data on an SSD1306-based display try my other project Tiny Function Plotter.
The circuit
Because I2C only requires two I/O lines the graphics display leaves three lines free on an ATtiny85 for use by your own application:
Connecting an I2C OLED display to an ATtiny85 for use with the Tiny Graphics Library.
The program
I developed and tested this library by first writing it in uLisp, my small Lisp interpreter for the Arduino, which enabled me to test parts of the library interactively simply by typing them into the Serial Monitor; see Graphics display interface in Lisp. At one stage I was a bit stumped because I wasn't getting the correct data read back from the display. I eventually found a note hidden in the datasheet saying that you have to do a dummy read before reading the actual data, and when I did that it all worked.
The library provides the following commands:
ClearDisplay() - clears the display.
InitDisplay() - Initialises the display. You need to do this after applying power.
PlotPoint(x, y) - plots a point at (x, y).
MoveTo(x, y) - moves the plot position to (x, y).
DrawTo(x, y) - draws a line from the plot position to (x, y).
PlotCharacter(c, x, y) - plots the ASCII character c with its bottom left-hand corner at (x, y).
PlotText(s) - plots a text string from flash memory, starting at the current plot position.
The display coordinates
The graphics library assumes the origin (0, 0) is in the bottom left corner, so the top right corner is (127, 63).
The display is divided into eight 8-pixel high bands, referred to as pages, and a byte corresponds to a vertical column of 8 pixels, with the bits ordered as shown in the following diagram:
Initialise the display
The routine InitDisplay() sets up the display and turns it on:
void InitDisplay () {
  Wire.beginTransmission(address);
  Wire.write(commands);
  Wire.write(0xA1);  // Flip horizontal
  Wire.write(0xAF);  // Display on
  Wire.endTransmission();
}
Write a command to the display
The routine single writes a single display command to the display:
void Single (uint8_t x) {
  Wire.write(onecommand);
  Wire.write(x);
}
Clear the screen
The ClearDisplay() routine clears the screen by writing zero bytes to the display.
void ClearDisplay () {
  for (int p = 0 ; p < 8; p++) {
    Wire.beginTransmission(address);
    Single(0xB0 + p);
    Wire.endTransmission();
    for (int q = 0 ; q < 8; q++) {
      Wire.beginTransmission(address);
      Wire.write(data);
      for (int i = 0 ; i < 20; i++) Wire.write(0);
      Wire.endTransmission();
    }
  }
}
It's slightly complicated by the need to cater for the 32-byte buffer limit of the Arduino core I2C routines.
Plot a point
The PlotPoint() routine plots a point at the specified coordinates. It reads a byte from display memory, sets a bit in the appropriate position, and then writes it back again:
void PlotPoint (int x, int y) {
  Wire.beginTransmission(address);
  Single(0x00 + ((x + 2) & 0x0F));        // Column low nibble
  Single(0x10 + ((x + 2)>>4));            // Column high nibble
  Single(0xB0 + (y >> 3));                // Page
  Single(0xE0);                           // Read modify write
  Wire.write(onedata);
  Wire.endTransmission();
  Wire.requestFrom(address, 2);
  Wire.read();                            // Dummy read
  int j = Wire.read();
  Wire.beginTransmission(address);
  Wire.write(onedata);
  Wire.write((1<<(y & 0x07)) | j);
  Single(0xEE);                           // Cancel read modify write
  Wire.endTransmission();
}
The first three commands set the bottom and top nibbles of the column number, and the page number. The SH1106 supports displays up to 132x64, so for the 128x64 display we're using you have to add an offset of 2 to the x value.
Move the plotting position
The MoveTo() routine moves the plotting position x0,y0:
void MoveTo (int x, int y) {
  x0 = x;
  y0 = y;
}
Draw a line
The DrawTo() routine draws from the current plotting position to the point x,y:
void DrawTo (int x, int y) {
  int sx, sy, e2, err;
  int dx = abs(x - x0);
  int dy = abs(y - y0);
  if (x0 < x) sx = 1; else sx = -1;
  if (y0 < y) sy = 1; else sy = -1;
  err = dx - dy;
  for (;;) {
    PlotPoint(x0, y0);
    if (x0==x && y0==y) return;
    e2 = err<<1;
    if (e2 > -dy) { err = err - dy; x0 = x0 + sx; }
    if (e2 < dx) { err = err + dx; y0 = y0 + sy; }
  }
}
This uses Bresenham's line algorithm to draw the best line between two points without needing any divisions or multiplications [4].
Plot a character
Here's the routine PlotChar() to plot a character with its bottom left corner at x,y:
void PlotChar (int c, int x, int y) {
  int h = y & 0x07;
  for (int p = 0; p < 2; p++) {
    Wire.beginTransmission(address);
    Single(0xB0 + (y >> 3) + p);          // Page
    for (int col=0; col<6; col++) {
      Single(0x00 + ((x+2+col) & 0x0F));  // Column low nibble
      Single(0x10 + ((x+2+col)>>4));      // Column high nibble
      Single(0xE0);                       // Read modify write
      Wire.write(onedata);
      Wire.endTransmission();
      Wire.requestFrom(address, 2);
      Wire.read();                        // Dummy read
      int j = Wire.read();
      Wire.beginTransmission(address);
      Wire.write(onedata);
      int bits = ReverseByte(pgm_read_byte(&CharMap[c-32][col]));
      Wire.write((bits<<h)>>(p<<3) | j);
      Single(0xEE);                       // Cancel read modify write
    }
    Wire.endTransmission();
  }
}
To allow you to plot a character to an abritrary vertical pixel position the routine plots the bottom half of the character in one page, and the top half in the next page, both shifted by the appropriate amount. The routine uses ReverseByte() to reverse the order of the bits in the CharMap array to correspond to the order on the display.
Plot text
Finally PlotText() plots constant text from flash memory to the display, starting at the current plot position:
void PlotText(PGM_P s) {
  int p = (int)s;
  while (1) {
    char c = pgm_read_byte(p++);
    if (c == 0) return;
    PlotChar(c, x0, y0);
    x0 = x0 + 6;
  }
}
It uses PlotChar() to plot the characters.
Temperature log demo
Here's a simple program that demonstrates all these commands. It measures the temperature every 15 minutes and plots it on the display to an accuracy of 0.5°C.
The circuit
Here's the circuit:
Circuit using the Tiny Graphics Library to plot the outside temperature over 24 hours.
For the temperature sensor I used the Analog Devices TMP37, which is similar to the TMP36 available from SparkFun [5]. It gives a voltage proportional to temperature that you can measure with an analogue input, and is more accurate than the ATtiny85's internal temperature sensor.
The program
Here's the demo program:
const int Now = 1547;                   // To set the time; eg 15:47
unsigned long StartMins = (unsigned long)((Now/100)*60 + (Now%100));

void loop () {
  unsigned int SampleNo = StartMins/15;
  // Plot temperature graph
  int x1 = 16, y1 = 11;
  int yscale = 2;                         // Points per degree
  MoveTo(26, 56); PlotText(PSTR("Temperature ~C"));
  // Horizontal axis
  MoveTo(x1, y1); DrawTo(x1+96, y1);
  for (int i=0; i<=24; i=i+4) {
    int mark = x1+i*4;
    MoveTo(mark, y1); DrawTo(mark, y1-2);
    int tens = i/10;
    if (tens != 0) {
      PlotChar(tens+'0', mark-6, y1-12);
      PlotChar(i%10+'0', mark, y1-12);
    } else PlotChar(i%10+'0', mark-3, y1-12);
  }
  // Vertical axis
  MoveTo(x1, y1); DrawTo(x1, y1+50);
  for (int i=5; i<=25; i=i+5) {
    int mark = y1+i*yscale-10;
    MoveTo(x1, mark); DrawTo(x1-2, mark);
    int tens = i/10;
    if (tens != 0) PlotChar(tens+'0', x1-15, mark-3);
    PlotChar(i%10+'0', x1-9, mark-3);
  }
  for (;;) {
    // Now start plotting the temperature every 15 mins
    while ((unsigned long) ((StartMins + millis()/60000)/15)%96 == SampleNo);
    // Time to take a new reading
    SampleNo = (SampleNo+1)%96;
    int Temperature = (analogRead(A2)*25)/233;  // In half degrees
    PlotPoint(SampleNo+x1, Temperature-10+y1);
  }
}
In setup() I set the analogue reference voltage to 1.1V with:
analogReference(INTERNAL1V1);
Since the TMP37 gives a voltage of 20mV per °C, and 0mV at 0°C, we need to divide the analogRead() value by (1024/1100)*10 or about 9.3 to get the number of half degrees. A good approximation to this is 233/25.
If you're using the TMP36, which gives a voltage of 10mV per °C and 500mV at 0°C, change the line to:
int Temperature = ((analogRead(A2)-465)*50)/233; // In half degrees
To run the demo set the variable Now to the current time (don't include a leading zero) and upload the program. The program will plot the temperature at the next quarter of an hour mark, and every 15 minutes subsequently.
Compiling the demo
I compiled the demo program using Spence Konde's ATTiny Core [6]. Choose the ATtiny25/45/85 option under the ATtinyCore heading on the Board menu. Then choose Timer 1 Clock: CPU, B.O.D. Disabled, ATtiny85, 8 MHz (internal) from the subsequent menus. Choose Burn Bootloader to set the fuses appropriately. Then upload the program using ISP (in-system programming); I used Sparkfun's Tiny AVR Programmer Board; see ATtiny-Based Beginner's Kit.
Here's the whole graphics display interface and temperature demo in a single file: Tiny Graphics Library Program.
Further suggestions
These routines could be made a bit more efficient by eliminating unnecessary reads from and writes to the display. For example, when drawing a vertical line the current version of Point() reads and writes each display byte eight times, whereas it could check for this case and only read and write each byte once.
These routines only provide an OR plotting mode, which overwrites what was previously on the screen. Another useful mode is Exclusive-OR, so plotting the same thing a second time restores what was previously there. This, and other plotting modes, could be added as an option.
For efficiency these routines don't do any checking that you are drawing within the display area, and drawing outside this area can cause unpredictable effects. It would be fairly simple to add checking to the routines.
Updates
9th May 2018: Corrected the declaration of the character map from uint32_t to uint8_t.
23rd September 2018: Removed two redundant calls to Wire.endTransmission().
10th August 2019: Added a note about displays based on the SSD1306 driver.
- ^ Adafruit SSD1306 Library on GitHub
- ^ SH1106 Datasheet on Elecrow.com.
- ^ Geekcreit 1.3 Inch 4 Pin White OLED LCD Display on Banggood.
- ^ Bresenham's line algorithm on Wikipedia.
- ^ Temperature Sensor - TMP36 on SparkFun.
- ^ ATTinyCore on GitHub.
blog comments powered by Disqus