Compact TFT Graphics Library
29th December 2020
This is a compact graphics library that supports a range of different colour TFT displays, such as the displays from Adafruit and AliExpress. It uses standard Arduino SPI calls making it compatible with a variety of different boards and processors:
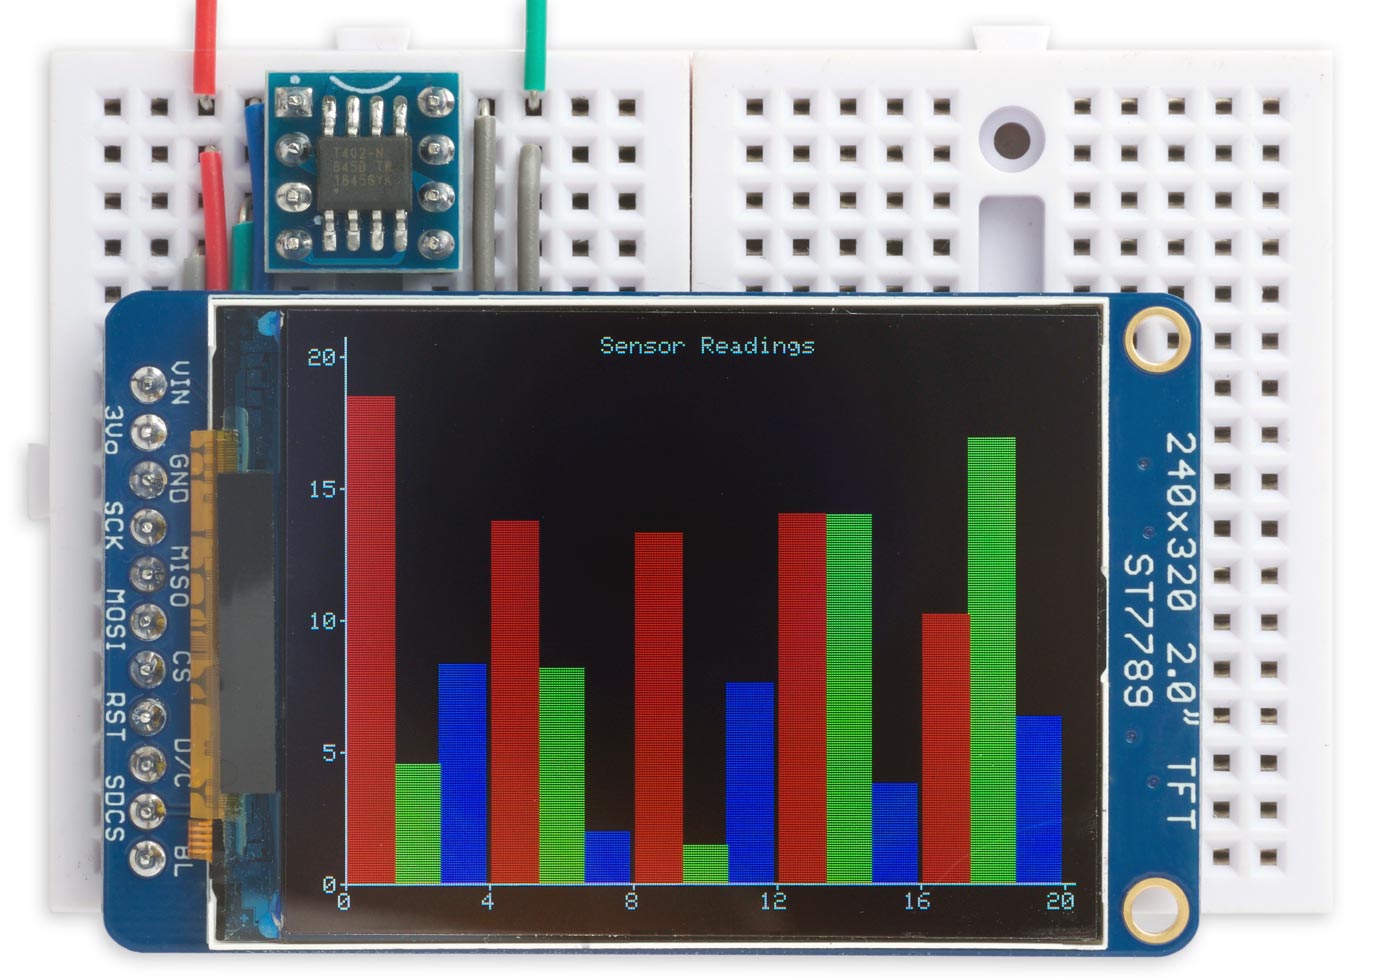
Compact TFT Graphics Library running on an ATtiny402 and
driving an Adafruit 320x240 colour TFT display.
It supports plotting points and drawing lines, drawing filled rectangles, and plotting characters and text in 16-bit colour. The library occupies less than 4K bytes, including the character set and demo program, and so will fit on microcontrollers with 4K flash such as the ATtiny45, ATtiny402, and ATtiny412.
Introduction
In my earlier article Tiny TFT Graphics Library I described a small graphics library designed for driving a variety of TFT displays from an ATtiny85. This library is an extension of that program, with the following enhancements:
- It uses standard Arduino SPI calls to interface with the display, so it will work with any board or processor that supports SPI.
- It includes support for some additional larger displays not supported by the earlier library.
Displays supported
The Compact TFT Graphics Library includes parameters for the following colour TFT displays:
| Manufacturer | Size | Width | Height | Voltage | Driver | Link |
| Adafruit | 1.44" | 128 | 128 | 3.3 - 5V | ST7735R | Adafruit 1.44" Color TFT LCD Display * |
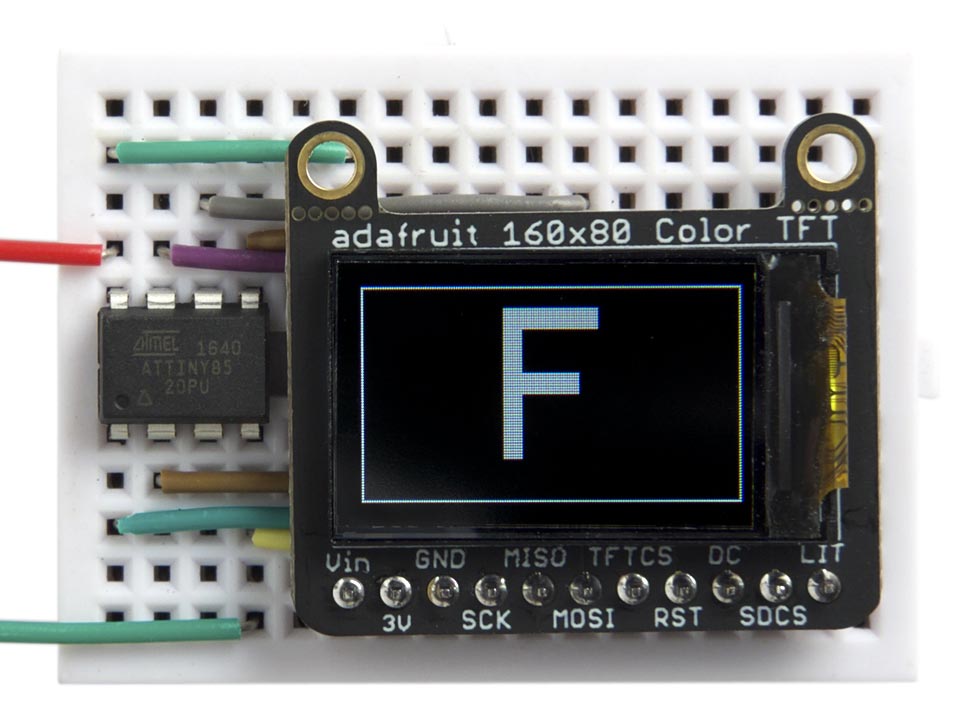
| Adafruit | 0.96" | 160 | 80 | 3.3 - 5V | ST7735 | Adafruit 0.96" 160x80 Color TFT Display * |
| AliExpress | 0.96" | 160 | 80 | 3.3V | ST7735 | TFT Display 0.96 inch 80x160 † |
| Adafruit | 1.8" | 160 | 128 | 3.3 - 5V | ST7735R | Adafruit 1.8" Color TFT LCD display |
| AliExpress | 1.8" | 160 | 128 | 3.3V | ST7735R | 1.8 inch TFT LCD Module 128x160 |
| Adafruit | 1.14" | 240 | 135 | 3.3 - 5V | ST7789 | Adafruit 1.14" 240x135 Color TFT Display * |
| AliExpress | 1.14" | 240 | 135 | 3.3V | ST7789 | 1.14in SPI 240x135 RGB TFT display † |
| Adafruit | 1.3" | 240 | 240 | 3.3 - 5V | ST7789 | Adafruit 1.3" 240x240 Wide Angle TFT LCD Display * |
| Adafruit | 1.54" | 240 | 240 | 3.3 - 5V | ST7789 | Adafruit 1.54" 240x240 TFT LCD Display * |
| AliExpress | 1.54" | 240 | 240 | 3.3V | ST7789 | 1.54" TFT 240x240 LCD Display † |
| Adafruit | 2.0" | 320 | 240 | 3.3 - 5V | ST7789 | Adafruit 2.0" 320x240 Color IPS TFT Display * |
* These Adafruit displays conveniently all have the same edge-connector layout, so you can make a prototyping board or PCB that will take any of them, like my Universal TFT Display Backpack.
† Likewise, these AliExpress displays have the same edge-connector layout.
Some of the AliExpress displays include a LDO 3.3V regulator, but as far as I can tell none of them include logic-level translation, so I recommend only interfacing them to a processor running from 3.3V.
The Adafruit displays all include an LDO 3.3V regulator and logic-level translation, so can be safely interfaced to processors powered from either 5V or 3.3V.
On the AliExpress 160x128 display you need to connect the backlight pin to Vcc to turn it on. This doesn't seem to be necessary with the other displays.
The library allows you to choose the orientation of the display image, to cater for different mounting choices.
The following photograph shows the AliExpress 240x135 display interfaced to an ATtiny402:
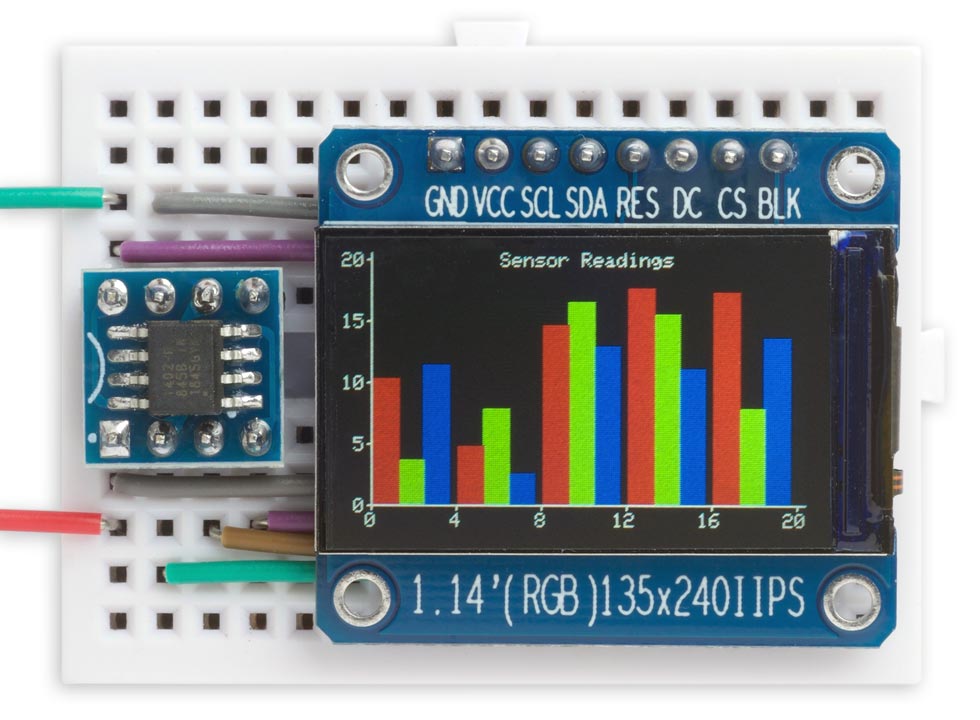
Compact TFT Graphics Library running on an ATtiny402 and
driving a 240x135 colour TFT display from AliExpress.
The library will probably support other TFT displays that use the same ST7735 or ST7789 driver chips, but you may need to experiment with the parameters to get the image scaled and centered correctly.
Using the graphics library
To use the graphics library you need to connect up the display correctly, and then select the correct parameters for the display you are using.
Connecting the display
The display needs to be connected to the microcontroller via four I/O lines.
Two of these, Data In and Clock, are dictated by the SPI interface on the processor you are using. They are usually called MOSI and SCK on the pinout diagram, and they connect to the appropriate two pins on the display.
For the other two signals, Chip Select and Data/Command, you can use any two spare I/O lines on the processor. You need to specify the Arduino pin numbers of the two pins you are using at the start of the Compact TFT Graphics Library listing; for example, to use the ATtiny402 circuit below:
int const cs = 0;
int const dc = 1;
Note that on different display boards the pins are labelled in a variety of ways:
| Pin | Labelled |
| Vcc | Vin |
| Ground | GND |
| Clock | SCK, SCL |
| Data In | MOSI, SI, SDA |
| Chip Select | CS, TCS |
| Data/Command | DC, D/C, A0 |
| Backlight | LITE, LIT, BLK |
Don't be confused by pins labelled SCL and SDA on some displays; these are all definitely SPI displays!
Typical diagram
Here's a typical circuit diagram, showing an AliExpress display connected to an ATtiny402:
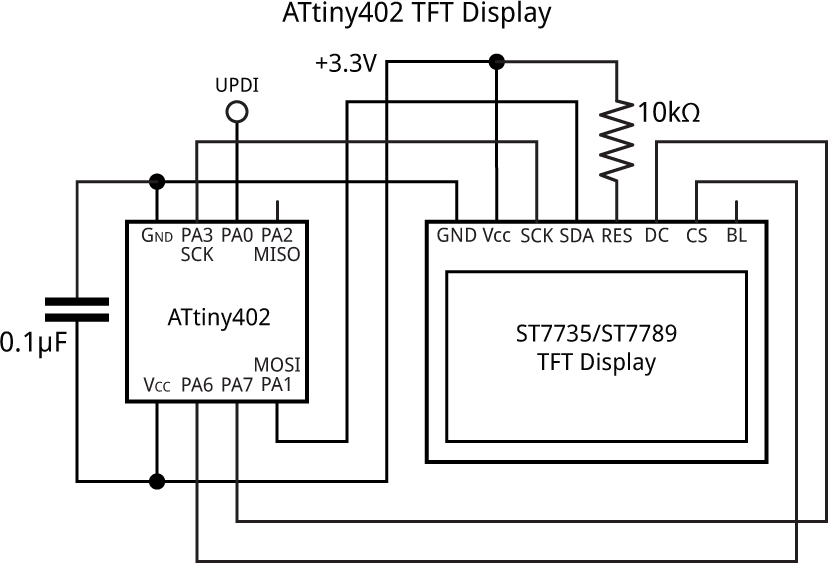
Circuit of the TFT colour graphics display interface using an ATtiny402.
You can omit the 10kΩ pullup if you're using an Adafruit display, as these include a pullup on the board.
To test this circuit I used Spence Konde's megaTinyCore [1].
ATtiny chips with USI
This graphics library will work with ATtiny processors that support SPI using the hardware USI peripheral, such as the ATtiny85, ATtiny84, and ATtiny4313, but note that on these devices the MOSI pin is labelled DO.
Graphics commands
Here is a summary of the graphics commands provided by this library:
Colour
The library uses a 16-bit colour mode, which assigns 5 bits to red, 6 bits to green, and 5 bits blue.
Colour() lets you create a colour value by specifying its red, green, and blue components as numbers from 0 to 255:
unsigned int Colour (int r, int g, int b)
Foreground and background
The foreground and background colours are defined by the two global variables fore and back. Initially these are set to 0xFFFF, white, and 0, black, respectively:
int fore = 0xFFFF; // White
int back = 0;      // Black
Clearing the display
ClearDisplay() clears the display to black:
void ClearDisplay ()
Plotting points and drawing lines
The library includes basic graphics routines for plotting points and drawing lines. These work on a conventional coordinate system with the origin at lower left. For example, on the 80x160 display:
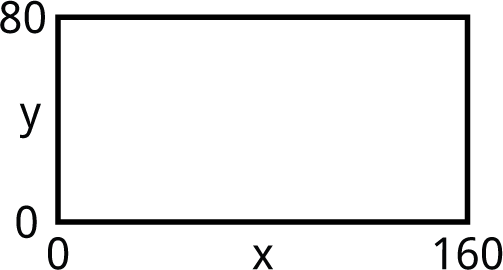
The current drawing position is stored in the global variables x0 and y0. You can change this with MoveTo():
void MoveTo (int x, int y)
PlotPoint() plots a single point in the current foreground colour:
void PlotPoint (int x, int y)
DrawTo() draws a line in the foreground colour from the current drawing position to x,y:
void DrawTo (int x, int y)
Drawing rectangles
FillRect() draws a filled rectangle in the foreground colour at the current drawing position, with width w and height h:
void FillRect (int w, int h)
Characters and text
The library includes a character set based on a 5x7 dot matrix.
PlotChar() plots a specified character at the current plot position, and in the current foreground colour:
void PlotChar (char c)
You can plot larger characters by setting the global variable scale, default value 1. After plotting a character PlotChar() moves the plot position to the start of the next character to make it easy to plot several characters in a row without needing to call MoveTo().
PlotText() allows you to plot text from a string in program memory:
void PlotText (PGM_P p)
See the demo program for an example.
Adding support for a new display
The different displays are catered for by six constants which specify the size of the display, the offsets relative to the area supported by the display driver, whether the display is inverted, and the rotation value; for example:
// Adafruit 0.96" 80x160 display
int const ysize = 80, xsize = 160, yoff = 24, xoff = 0, invert = 0, rotate = 0;
Uncomment the parameters for the display you're using.
The display driver allows you to rotate the display into any orientation, specified by the value of the constant rotate:
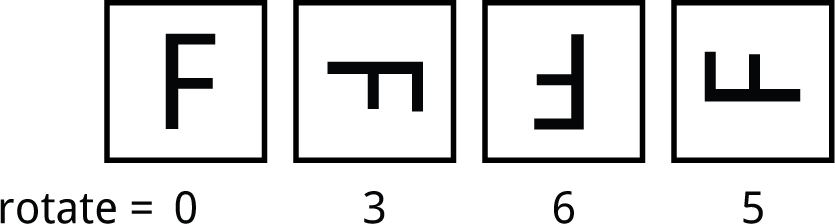
Test pattern displayed on an Adafruit 160x80 TFT display.
This gives you the freedom to mount the display in whatever orientation you prefer.
Note that on some displays you may also have to change the xoff or yoff value when rotating the display. For example, to rotate the image on the 240x240 displays by 180° use the settings:
int const ysize = 240, xsize = 240, yoff = 80, xoff = 0, invert = 1, rotate = 5;
To check or adjust the values for each display I ran this program, which draws a one-pixel border around the display area, and plots an "F" to show the orientation:
void TestChart () {
  MoveTo(0,0);
  DrawTo(xsize-1, 0); DrawTo(xsize-1, ysize-1);
  DrawTo(0, ysize-1); DrawTo(0, 0);
  scale=8;
  MoveTo((xsize-40)/2, (ysize-64)/2); PlotChar('F');
  for(;;);
}
For example:
You can use this to find the correct parameters for a new display that I haven't included here.
Here's the Compact TFT Graphics Library: Compact TFT Graphics Library Program.
Or get it from GitHub here: https://github.com/technoblogy/compact-tft-graphics-library.
Updates
20th January 2021: Added support for the AliExpress 1.54" 240x240 colour TFT display.
24th July 2021: Renamed x0, y0 as xorigin, yorigin to avoid conflict with some Arduino cores.
9th May 2022: As a result of working on my Tiny TFT Graphics Library 2 I've made the following improvements:
- Added parameters for six more displays.
- Added a bgr parameter to fix the problem that blue and red were swapped on some displays.
- Fixed a problem with FillRect() for large rectangles.
- Added PlotInt() to plot an integer, and used it to simplify the BarChart() demo.
- ^ megaTinyCore on GitHub
blog comments powered by Disqus