Controlling RGB LED Strips with a Single Function
4th February 2022
This article describes a new approach to driving DotStar RGB LED strips, by defining a single space-time function describing the display to be generated:
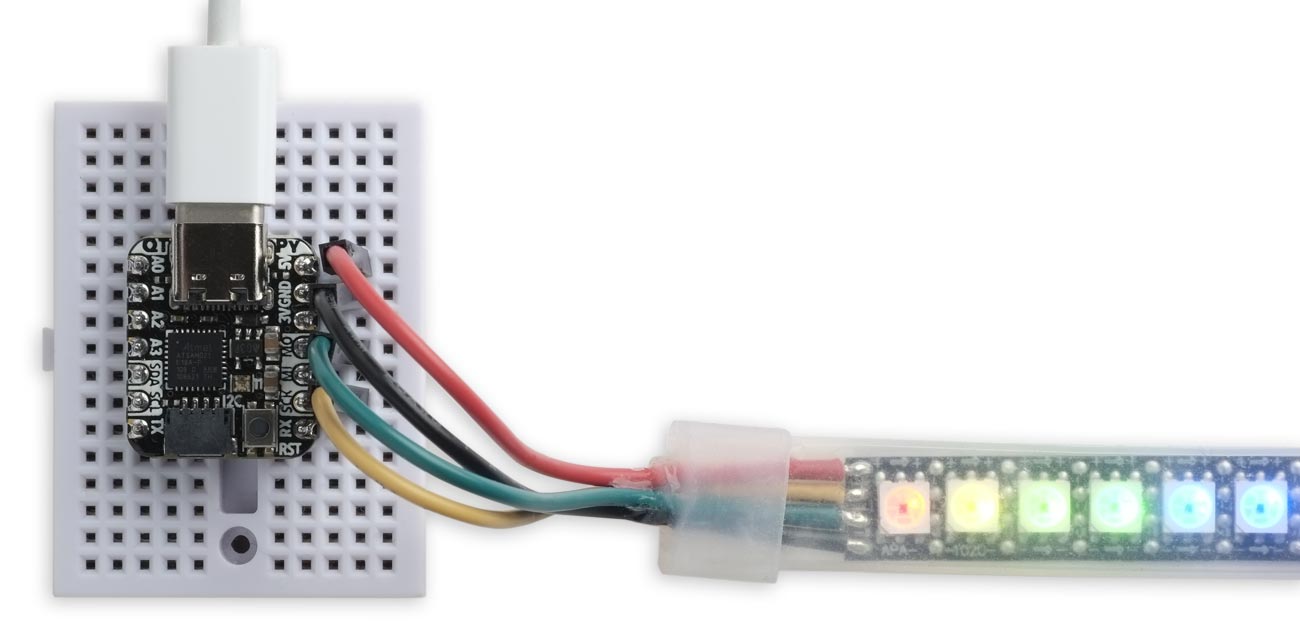
A DotStar RGB LED strip controlled by this program running on an Adafruit QT-Py M0 board.
Introduction
This program will work with DotStar strips, which use either APA102 or SK9822 [1] serial-controlled RGB LEDs. You can drive these using the standard Arduino SPI library, and so the program should run on any Arduino-compatible board without modification. I've tested it on an Arduino Uno and a ATSAMD21-based Adafruit QT‑Py M0 board.
Suitable RGB LED strips
The strips typically come in multiples of 1 metre, with either 30, 60, or 144 LEDs per metre. I've tested the program with a 1-metre strip with 30 LEDs, and a half-metre strip with 72 LEDs.
Here are some suggested suppliers:
- Adafruit: 30 LED/m, 60 LED/m and 144 LED/m on both white and black flex PCB.
- Pimoroni: Flexible RGB LED Strip (DotStar/APA102/SK9822 compatible).
- AliExpress: SK9822 (Similar APA102) Smart RGB Led Pixel Strip.
The slightly cheaper WS2812 or SK6812 strips, called NeoPixels by Adafruit, are trickier to drive and are not compatible with this program as it stands.
Connecting DotStar strips
Here's a quick introduction to connecting up DotStar strips. For fuller information see Adafruit's tutorial.
With 30 LEDs you should be able to power the LEDs from the USB supply on the board you are using without needing an external power supply, provided you keep the brightness down. The program below sets the global brightness to a value that should keep the current to a safe value.
With more than 30 LEDs, or using a higher global brightness, you'll need to power the LED strip from external power. But note that the clock and data logic levels to the LED strip shouldn't be at a higher voltage than the power to the strip, so the options are:
- If you're using a board with 5V logic levels, like the Arduino Uno, the external power supply should be 5V.
- If you're using a board with 3.3V logic levels, like an ATSAMD21 board, the external power supply can be between 5V and 3.3V, so a 3.7V Lipo battery would be suitable.
For example, the following diagram shows how to connect a DotStar strip to an Adafruit QT-Py M0 using 5V USB power:
Typical wiring diagram for connecting a DotStar strip to a microcontroller board.
Controlling DotStar strips
The conventional approach
The usual approach to creating LED strip displays is to initialise the strip by specifying the number of LEDs in the strip. You then specify the colour of each LED with a call such as:
strip.setPixelColor(n, red, green, blue);
After setting the colours of the LEDs, to make the change take effect you have to call:
strip.show();
If you want to create a dynamic, changing light display you write a program to handle the changes and timing that you want to use.
This space-time function driver works in a different way.
The space-time LED driver function
The approach I'm proposing is to define the light display you want to create by a single function which takes two floating-point parameters: x, the position on the strip, and t, the time. It returns a pointer to an array of three floating-point numbers:
float *Driver (float x, float t)
Here are details of each of the parameters and return value:
float x – position
The parameter x specifies the position along the strip, and is a floating-point value between 0, corresponding to the left-hand end of the strip, and 1.0, corresponding to the right-hand end. This space-time function treats the LED strip as a continuous one-dimensional band of light, so it is not concerned with the number of LEDs in the strip.
float t – time
The parameter t specifies the time, which is a floating point value starting from 0, in seconds.
float rgb[3] - return value
The space-time function returns a pointer to an array of three floating-point values between 0 and 1.0 specifying the red, green, and blue components of the point on the strip defined by x and t.
That's all there is to it; a single function defines the light display over space and time. It makes it easy to create smooth, dynamic LED strip display patterns with a single function.
The other advantages to this approach is that it's simple to implement, and doesn't require a memory buffer to store the rgb data for the LEDs.
The following sections explain how to write the space-time function, and give examples with animated GIFs showing roughly what each display looks like; in practice the displays are smoother and more colourful than these suggest.
Creating an LED driver function
Since the procedure for designing a space-time driver function is a bit different from writing a program to control RGB LEDs, I thought it would be illuminating to work through a couple of simple examples.
Gradient
![]()
This Gradient example is perhaps the simplest possible LED driver function:
float *Gradient (float x, float t) {
  static float rgb[3];
  rgb[red]   = x;
  rgb[green] = 0;
  rgb[blue]  = 0;
  return rgb;
}
The value of the red component simply changes smoothly with its position x across the strip.
Cylon

The next example shows how the space-time approach makes it easy to create smooth displays.
A good approach to creating a smooth display is to make the brightness change with a gradual function, and a convenient function to use is a section of a sine wave. Suppose we want to create a smooth red peak, fading out towards the edges of the strip:
The equation for this is:
value = (1 - cos(x * 2 * pi))/2;
Now let's make it a quarter of the width:
The equation for this is:
value = (1 - cos(4 * clamp(x, 0, 0.25) * 2 * pi)) / 2;
The expression:
clamp(x, 0, 0.25)
windows the part of the cosine curve between x=0 and x=0.25; otherwise the curve would continue repeating all the way up to x=1.
Finally, let's make the red peak oscillate left and right with time, like a pendulum. We want the centre of the peak to move right from 0.125 to 0.875, following a sine-wave motion centred on 0.5. So we subtract from x:
0.375 * (1 - sin(2 * pi * t/4.0));
giving us the final equation:
float x2 = 0.375 * (1 - sin(2 * pi * t/4));
float value = (1 - cos(clamp(x-x2, 0, 0.25) * 8 * pi)) / 2;
Finally, here's the whole Cylon space-time function:
float *Cylon (float x, float t) {
  static float rgb[3];
  float x2 = 0.375 * (1 - sin(2 * pi * t/4));
  float value = (1 - cos(clamp(x-x2, 0, 0.25) * 8 * pi)) / 2;
  rgb[red]   = value;
  rgb[green] = 0;
  rgb[blue]  = 0;
  return rgb;
}
It's simple to modify the behaviour of this display by changing specific parameters. For example:
- To make the bar oscillate twice as fast change t/4 to t/2.
- To change the colour of the bar, assign the value to the appropriate components of rgb[]. For example, to make it orange change the assignments to:
 rgb[red]   = value;
 rgb[green] = value/2;
 rgb[blue]  = 0;
- To make other effects happen at the same time, add them to the rgb[] values.
For more examples, see Examples below.
The program
Here's the program for the space-time function RGB LED driver. First some constants:
// Constants
const int LEDs = 72;                            // Adjust this for your LED strip
const int Brightness = 1;                       // Global brightness 1 to 31
enum rgb_values { red, green, blue };
enum hsv_values { hue, sat, value };
const float pi = acos(0) * 2;
The constant LEDs specifies the number of LEDs in the strip.
The global Brightness value determines the overall brightness of the display, and can be set to between 1 and 31. For indoor use I find that anything above 3 is dazzling.
The constants red, green, blue are convenient symbols for the elements of the rgb[] array, and finally pi is the constant pi.
I've also provided two useful utility functions:
// Utilities
float fract (float x) { return x - int(x); }
float clamp (float v, float lo, float hi) { return (v<lo) ? lo : (v>hi) ? hi : v; }
The function fract returns the fractional part of a floating-point number, and clamp constrains a value to a minimum lo and a maximum hi.
The function WriteLEDs() writes the bytes representing the red, green, and blue values to the serial output:
void WriteLEDs (float *rgb) {
  for (int i=2; i>=0; i--) SPI.transfer(round(powf(2.0, rgb[i]*8)) - 1);
}
It transforms the floating-point value of each component with the exponential function powf() to make the LED brightness proportional to the value, so setting a component to 0.5 will make it look half as bright as setting it to 1.0.
The main program then repeatedly evaluates the LED driver function and updates the LED strip:
void setup() {
  SPI.begin();
}

void loop() {
  long start = millis();
  for (;;) {
    float t = (float)(millis() - start) / 1000.0;
    for (int i=0; i<4; i++) SPI.transfer(0);    // Start frame
    for (int i=0; i<LEDs; i++) {
      SPI.transfer(min(Brightness, 31) + 0xE0); // Brightness 0-31
      float x = (float)i/(float)LEDs;
      WriteLEDs(Cylon(x, t));                   // Call the space-time function
    }
    for (int i=0; i<4; i++) SPI.transfer(0);    // End frame
  }
}
The space-time fiunction is called by WriteLEDs(). To use a different function, change Cylon to the name of the function you want to use in the line:
WriteLEDs(Cylon(x, t));
A link to the whole program, including all the examples, is given at the end of the article.
Examples
Here are some more examples of space-time LED driver functions.
Chameleon

This example makes the whole strip gradually cycle through all the colour combinations over 21 seconds:
float *Chameleon (float x, float t) {
  static float rgb[3];
  rgb[red]   = abs(2*fract(t/21) - 1);
  rgb[green] = abs(2*fract((7 + t)/21) - 1);
  rgb[blue]  = abs(2*fract((14 + t)/21) - 1);
  return rgb;
}
Each component is a triangle wave which varies from 1.0 down to 0 and back up to 1.0 as a function of time, and the three components are out of phase.
Twin Peaks

This example gives red and blue peaks rotating in opposite directions:
float *TwinPeaks (float x, float t) {
  static float rgb[3];
  float colour1 = (1 - cos(clamp(fract(x + t), 0, 0.5) * 4 * pi)) / 2;
  float colour2 = (1 - cos(clamp(fract(1 - x + t), 0, 0.5) * 4 * pi)) / 2;
  rgb[red]   = colour1;
  rgb[green] = 0;
  rgb[blue]  = colour2;
  return rgb;
}
The peaks are defined in the same way as in the Cylon example above, but these are each half the width of the strip.
Explosion

This example features green, orange, and blue bands growing outwards from the centre of the strip:
float *Explosion (float x, float t) {
  static float rgb[3];
  float tt = (fmod(t/100, 20.0) - 10.0);
  float xx = 2*x - 1.0;
  float f =  xx * xx + tt * tt;
  rgb[red]   = fract(f + 0.33);
  rgb[green] = fract(f);
  rgb[blue]  = fract(f + 0.66);
  return rgb;
}
Scanner

This example features a single red LED repeatedly travelling along the strip:
float *Scanner (float x, float t) {
  static float rgb[3];
  int xx = x * (float)LEDs;
  int tt = (int)(t / 2.0 * (float)LEDs) % LEDs;
  rgb[red]   = (xx == tt) ? 1 : 0;
  rgb[green] = 0;
  rgb[blue]  = 0;
  return rgb;
}
Pendulums

This features single red, green, blue, and cyan LEDs bouncing back and forwards along the strip in a pendulum (sine) motion:
float *Pendulums (float x, float t) {
  static float rgb[3];
  int xx = x * (float)LEDs;
  float s = sin(2 * pi * (t / 4.0));
  float c = cos(2 * pi * (t / 4.0));
  float h = (float)LEDs/2;
  int t0 = (s + 1) * h;  // Red
  int t1 = (c + 1) * h;  // Green
  int t2 = (1 - s) * h;  // Blue
  int t3 = (1 - c) * h;  // Cyan
  rgb[red]   = (xx == t0) ? 1 : 0;
  rgb[green] = (xx == t1 | xx == t3) ? 1 : 0;
  rgb[blue]  = (xx == t2 | xx == t3) ? 1 : 0;
  return rgb;
}
Fireworks

This example features red, green, and blue smooth peaks that appear suddenly, and then fade away before the next one appears:
float *Fireworks (float x, float t) {
  static float rgb[3];
  float value1 = (1 - cos(clamp(x, 0, 0.5) * 4 * pi)) / 2;
  float value2 = (1 - cos(clamp(x-0.25, 0, 0.5) * 4 * pi)) / 2;
  float value3 = (1 - cos(clamp(x-0.5, 0, 0.5) * 4 * pi)) / 2;
  rgb[red]   = (1 - fract(t/6))*value1;
  rgb[green] = (1 - fract((t+4)/6))*value2;
  rgb[blue]  = (1 - fract((t+2)/6))*value3;
  return rgb;
}
Using HSV
For some applications the HSV colour model is more useful than the RGB one. It expresses colours using the three components:
- Hue (H) takes a value between 0 and 1.0 which varies the colour across the entire spectrum.
- Saturation (S) determines the amount of white in the colour, between 0 which is pure white, and 1.0 which is fully saturated with no white.
- Value (V) determines the brightness of the colour, from 0, black, to 1.0, full brightness. It's called value rather than brightness because B would be confused with Blue in the RGB model.
I've included a routine HSVtoRGB() to convert between the colour models so you can design space-time LED driver functions that use the HSV model when it's more convenient:
float *HSVtoRGB (float *hsv) {
  static float rgb[3];
  const int xbits = 0b100100;
  const int cbits = 0b011000;
  float h = hsv[0]*6;
  float chroma = hsv[2] * hsv[1];
  float x = chroma * (1 - abs(fmod(h, 2) - 1));
  float m = hsv[2] - chroma;
  for (int i=0; i<3; i++) {
    int j = ((int)h + i*2) % 6;
    rgb[2-i] = m + (cbits>>j & 1) * chroma + (xbits>>j & 1) * x;
  }
  return rgb;
}
Here are some examples:
Spectrum
![]()
This gives a static display of the hue spectrum across the strip so you can see the range of colours available:
float *Spectrum (float x, float t) {
  static float hsv[3];
  hsv[hue]   = x;
  hsv[sat]   = 1;
  hsv[value] = 1;
  return HSVtoRGB(hsv);
}
Gradient2
![]()
This is an HSV version of the earlier RGB Gradient example, and gives a simple red gradient across the strip:
float *Gradient2 (float x, float t) {
  static float hsv[3];
  hsv[hue]   = 0;
  hsv[sat]   = 1;
  hsv[value] = x;
  return HSVtoRGB(hsv);
}
Mood light

This gives a slowly changing wave of colour across the whole strip that goes through all the available colours before taking 100 seconds to repeat:
float *MoodLight (float x, float t) {
  static float hsv[3];
  hsv[hue]   = fract(1 - x/6 + t/100);
  hsv[sat]   = 1;
  hsv[value] = 1;
  return HSVtoRGB(hsv);
}
The saturation and brightness are fixed at 100%, and the hue changes with distance along the strip, and time.
Twinkle

This gives flickering LEDs in different colours.
float *Twinkle (float x, float t) {
  static float hsv[3];
  int n = 1 + t * 10.0;
  int k = 30 + (int)(x * LEDs);
  hsv[hue]   = fract(x * 10);
  hsv[sat]   = 1;
  hsv[value] = (n % k == 0) ? 1 : 0;
  return HSVtoRGB(hsv);
}
The integer n increases as a function of time. When n is exactly divisible by k, which is a function of the position of each LED on the strip, that LED flashes. The colour of each LED is also a function of its position on the strip.
Resources
Here's the Single Function DotStar LED Strip Driver program together with all the examples: Single Function DotStar LED Strip Driver Program.
Acknowledgements
Thanks to Chris Jordan for suggestions, and comments on an earlier draft of this article.
- ^ SK9822 datasheet on Adafruit.
blog comments powered by Disqus