Colour Graphics Library
7th December 2018
This is a small colour graphics library for an SPI 96x64 colour OLED display based on an SD1331. It allows you to plot points, lines, filled and open rectangles, and text with small or large characters:
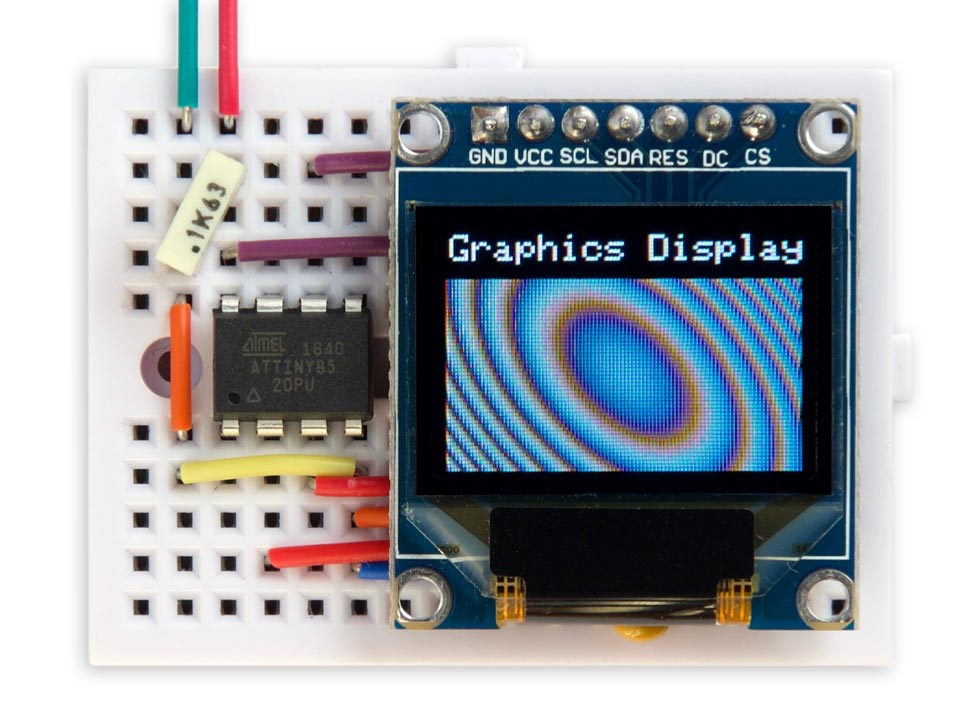
Colour Graphics Library running on an ATtiny85 with a 96x64 colour OLED display.
Unlike most other SPI OLED display libraries this one doesn't require a memory buffer, allowing it to be run on any processor down to an ATtiny85. It also requires only three pins to drive the display, leaving two pins free on an ATtiny85 to interface to other devices, such as I2C sensors.
Introduction
This library is based on a low-cost 96x64 OLED display with 64K colours, and an SPI interface. It's available from a number of suppliers including Adafruit [1] or Banggood [2].
Most OLED SPI display drivers make a distinction between commands and data. Command bytes configure the operation of the display, such as defining the pixel to write to. Data bytes are written into the display memory. To plot points, draw lines, clear the display, and plot text you have to write data. You identify whether bytes should be interpreted as commands or data by the state of the DC input: low for commands and high for data.
This display is based on the SD1331 driver chip [3], which is unique in having graphics accelerator commands that allow you to draw lines and rectangles without having to write into the graphics data memory. The graphics accelerator commands are really fast; the usual way to clear the screen is to write zeroes into the entire graphics data memory, and a test routine I wrote to do this took 91ms. Using the Clear Window graphics accelerator command took under one millisecond, a factor of 100 faster!
With the graphics accelerator commands it's possible to make a graphics library that doesn't actually need to write data directly to the display memory. In addition to being fast, this has the additional advantage of freeing up the DC pin, which can be tied permanently low. So there are now two free pins on the ATtiny85, enough to provide an I2C interface to connect up sensors and other devices.
The circuit
Here's the circuit:
Circuit of the 96x64 OLED colour graphics display based on an ATtiny85.
The following table shows how the pin names on the Geekcreit display shown in the above circuit diagram translate to the alternative Adafruit display [4]:
| Geekcreit display | Adafruit display |
| GND | GND (G) |
| VCC | VCC (+) |
| SCL | SCK (CK) |
| SDA | MOSI (SI) |
| RES | RST (R) |
| DC | D/C (DC) |
| CS | OCS (OC) |
The DC pin is tied low, and doesn't need to be connected to an ATtiny85 pin, because this graphics library is based entirely on commands rather than data. The resistor from the display's CS pin holds the chip select high to prevent the display from being affected by the ISP signals while programming the ATtiny85. The other 33kΩ resistor and the 0.1µF capacitor ensure that the display is reset cleanly on power-up.
Writing to the display
The ATtiny85 and other AVR processors supports toggling of one or more bits in a port, so provided you set all the pins to their disabled state at startup, for speed the display access routines can simply toggle the appropriate pins to enable or disable them.
The Send() routine sends a byte to the display by toggling the clock pin, clk, for each bit on the data pin:
void Send (uint8_t d) {
  for (uint8_t bit = 0x80; bit; bit >>= 1) {
    PINB = 1<<clk;                        // clk low
    if (d & bit) PORTB = PORTB | (1<<data); else PORTB = PORTB & ~(1<<data);
    PINB = 1<<clk;                        // clk high
  }
}
Before and after accessing the display you need to toggle the chip-select pin, cs, with the statement:
PINB = 1<<cs;
Clearing the display
To clear the display we use the graphics accelerator Clear Window command:
void ClearDisplay () {
  PINB = 1<<cs;                           // cs low
  Send(0x25);                             // Clear Window
  Send(0); Send(0); Send(95); Send(63);
  PINB = 1<<cs;                           // cs high
  delay(1);
}
That's all it takes! Note that this and some of the other commands include a 1ms delay to allow the command to execute. Although I couldn't find this mentioned in the datasheet I discovered that it was necessary in practice.
Colours
The red, blue, and green components of the foreground and background colours are defined by six global variables. Initially these are set to 0x3F, white, and 0x00, black, respectively:
uint8_t ForeR = 0x3F, ForeG = 0x3F, ForeB = 0x3F;
uint8_t BackR = 0x00, BackG = 0x00, BackB = 0x00;
Drawing lines and plotting points
I wrote some basic graphics routines for plotting points and drawing lines. These work on a conventional coordinate system with the origin at lower left:
The current drawing position is stored in the global variables x0 and y0. You can change this with the MoveTo() command:
void MoveTo (uint8_t x, uint8_t y) {
  x0 = x; y0 = y;
}
The routine to draw a line simply calls the graphics accelerator Draw Line command:
void DrawTo (uint8_t x, uint8_t y) {
  PINB = 1<<cs;                           // cs low
  Send(0x21);                             // Draw Line
  Send(x0); Send(y0); Send(x); Send(y);
  Send(ForeR); Send(ForeG); Send(ForeB);
  PINB = 1<<cs;                           // cs high
  x0 = x; y0 = x;
}
The graphics accelerator commands don't include an explicit command to plot a point, but you can achieve this by drawing a line one pixel long:
void PlotPoint (uint8_t x, uint8_t y) {
  MoveTo(x, y);
  DrawTo(x, y);
}
Drawing rectangles
The DrawRect() routine draws filled or outline rectangles using the graphics accelerator Draw Rectangle command:
void DrawRect (boolean filled, uint8_t x1, uint8_t y1, uint8_t x2, uint8_t y2) {
  PINB = 1<<cs;                           // cs low
  Send(0x26); Send(filled);               // Enable fill
  Send(0x22);                             // Draw rectangle
  Send(x1); Send(y1); Send(x2); Send(y2);
  Send(ForeR); Send(ForeG); Send(ForeB);
  Send(BackR); Send(BackG); Send(BackB);
  PINB = 1<<cs;                           // cs high
  delay(1);
}
Set filled to 0 for an outline rectangle, or 1 for a rectangle filled with the background colour.
Characters and text
The character set is defined by data stored in program memory. An abbreviated version of the character map is as follows:
const uint8_t CharMap[96][6] PROGMEM = {
{ 0x00, 0x00, 0x00, 0x00, 0x00, 0x00 },
{ 0x00, 0x00, 0x5F, 0x00, 0x00, 0x00 },
...
{ 0xFF, 0xFF, 0xFF, 0xFF, 0xFF, 0x00 }
};
The first row defines the bit patterns for ASCII character 32, space, and so on up to character 127.
The PlotChar() routine plots a character as a series of lines corresponding to the columns of contiguous pixels in the character bitmap. With this optimisation I found that plotting characters is actually faster than the usual method of writing bytes into the graphics data memory:
void PlotChar (uint8_t ch) {
  PINB = 1<<cs;                           // cs low
  for (uint8_t c = 0 ; c < 6; c++) {      // Column range
    uint8_t bits = pgm_read_byte(&CharMap[ch-32][c]);
    uint8_t r = 0;
    while (bits) {
      while ((bits & 1) == 0) {r++; bits = bits>>1; }
      uint8_t on = (7-r)*Scale;
      while ((bits & 1) != 0) {r++; bits = bits>>1; }
      uint8_t off = (7-r)*Scale+1;
      for (int i=0; i<Scale; i++) {
        uint8_t h = x0+c*Scale+i;
        Send(0x21);                         // Draw line
        Send(h); Send(y0+on); Send(h); Send(y0+off);
        Send(ForeR); Send(ForeG); Send(ForeB);
      }
    }
  }
  PINB = 1<<cs;                             // cs high
  x0 = x0+6*Scale;
}
Setting Scale to 2 plots double-sized characters.
Finally PlotText() allows you to plot text from a string in program memory:
void PlotText(PGM_P p) {
  while (1) {
    char c = pgm_read_byte(p++);
    if (c == 0) return;
    PlotChar(c);
  }
}
To define the text to be plotted as being in program memory use the PSTR() macro (for program string); for example:
PlotText(PSTR("Graphics Display"));
Compiling the program
I compiled the program using Spence Konde's ATTiny Core [5]. Choose the ATtiny25/45/85 option under the ATtinyCore heading on the Board menu. Then choose Timer 1 Clock: CPU, B.O.D. Disabled, ATtiny85, 8 MHz (internal) from the subsequent menus. Choose Burn Bootloader to set the fuses appropriately. Then upload the program using ISP (in-system programming); I used Sparkfun's Tiny AVR Programmer Board; see ATtiny-Based Beginner's Kit.
Here's the whole Colour Graphics Library program with the example used to draw the coloured ellipses for the photo at the start of the article: Colour Graphics Library Program.
Updates
17th December 2018: For consistency I've updated the code to use direct port accesses, rather than Arduino functions, to configure the I/O pins in setup().
18th November 2019: I've corrected the pin names for the display on the circuit diagram, and added a table to show how these translate to the names used on the Adafruit display.
17th June 2022: To rotate the display through 180° change 0x22 in the Init[] array to 0x30.
- ^ OLED Breakout Board 16-bit Color 0.96" on Adafruit
- ^ Geekcreit 0.95 inch 7 pin full colour SSD1331 SPI OLED display on Banggood.
- ^ SD1331 datasheet on Adafruit.
- ^ OLED Breakout Board 16-bit Color 0.96" on Adafruit
- ^ ATTinyCore on GitHub.
blog comments powered by Disqus